Using charts of different types
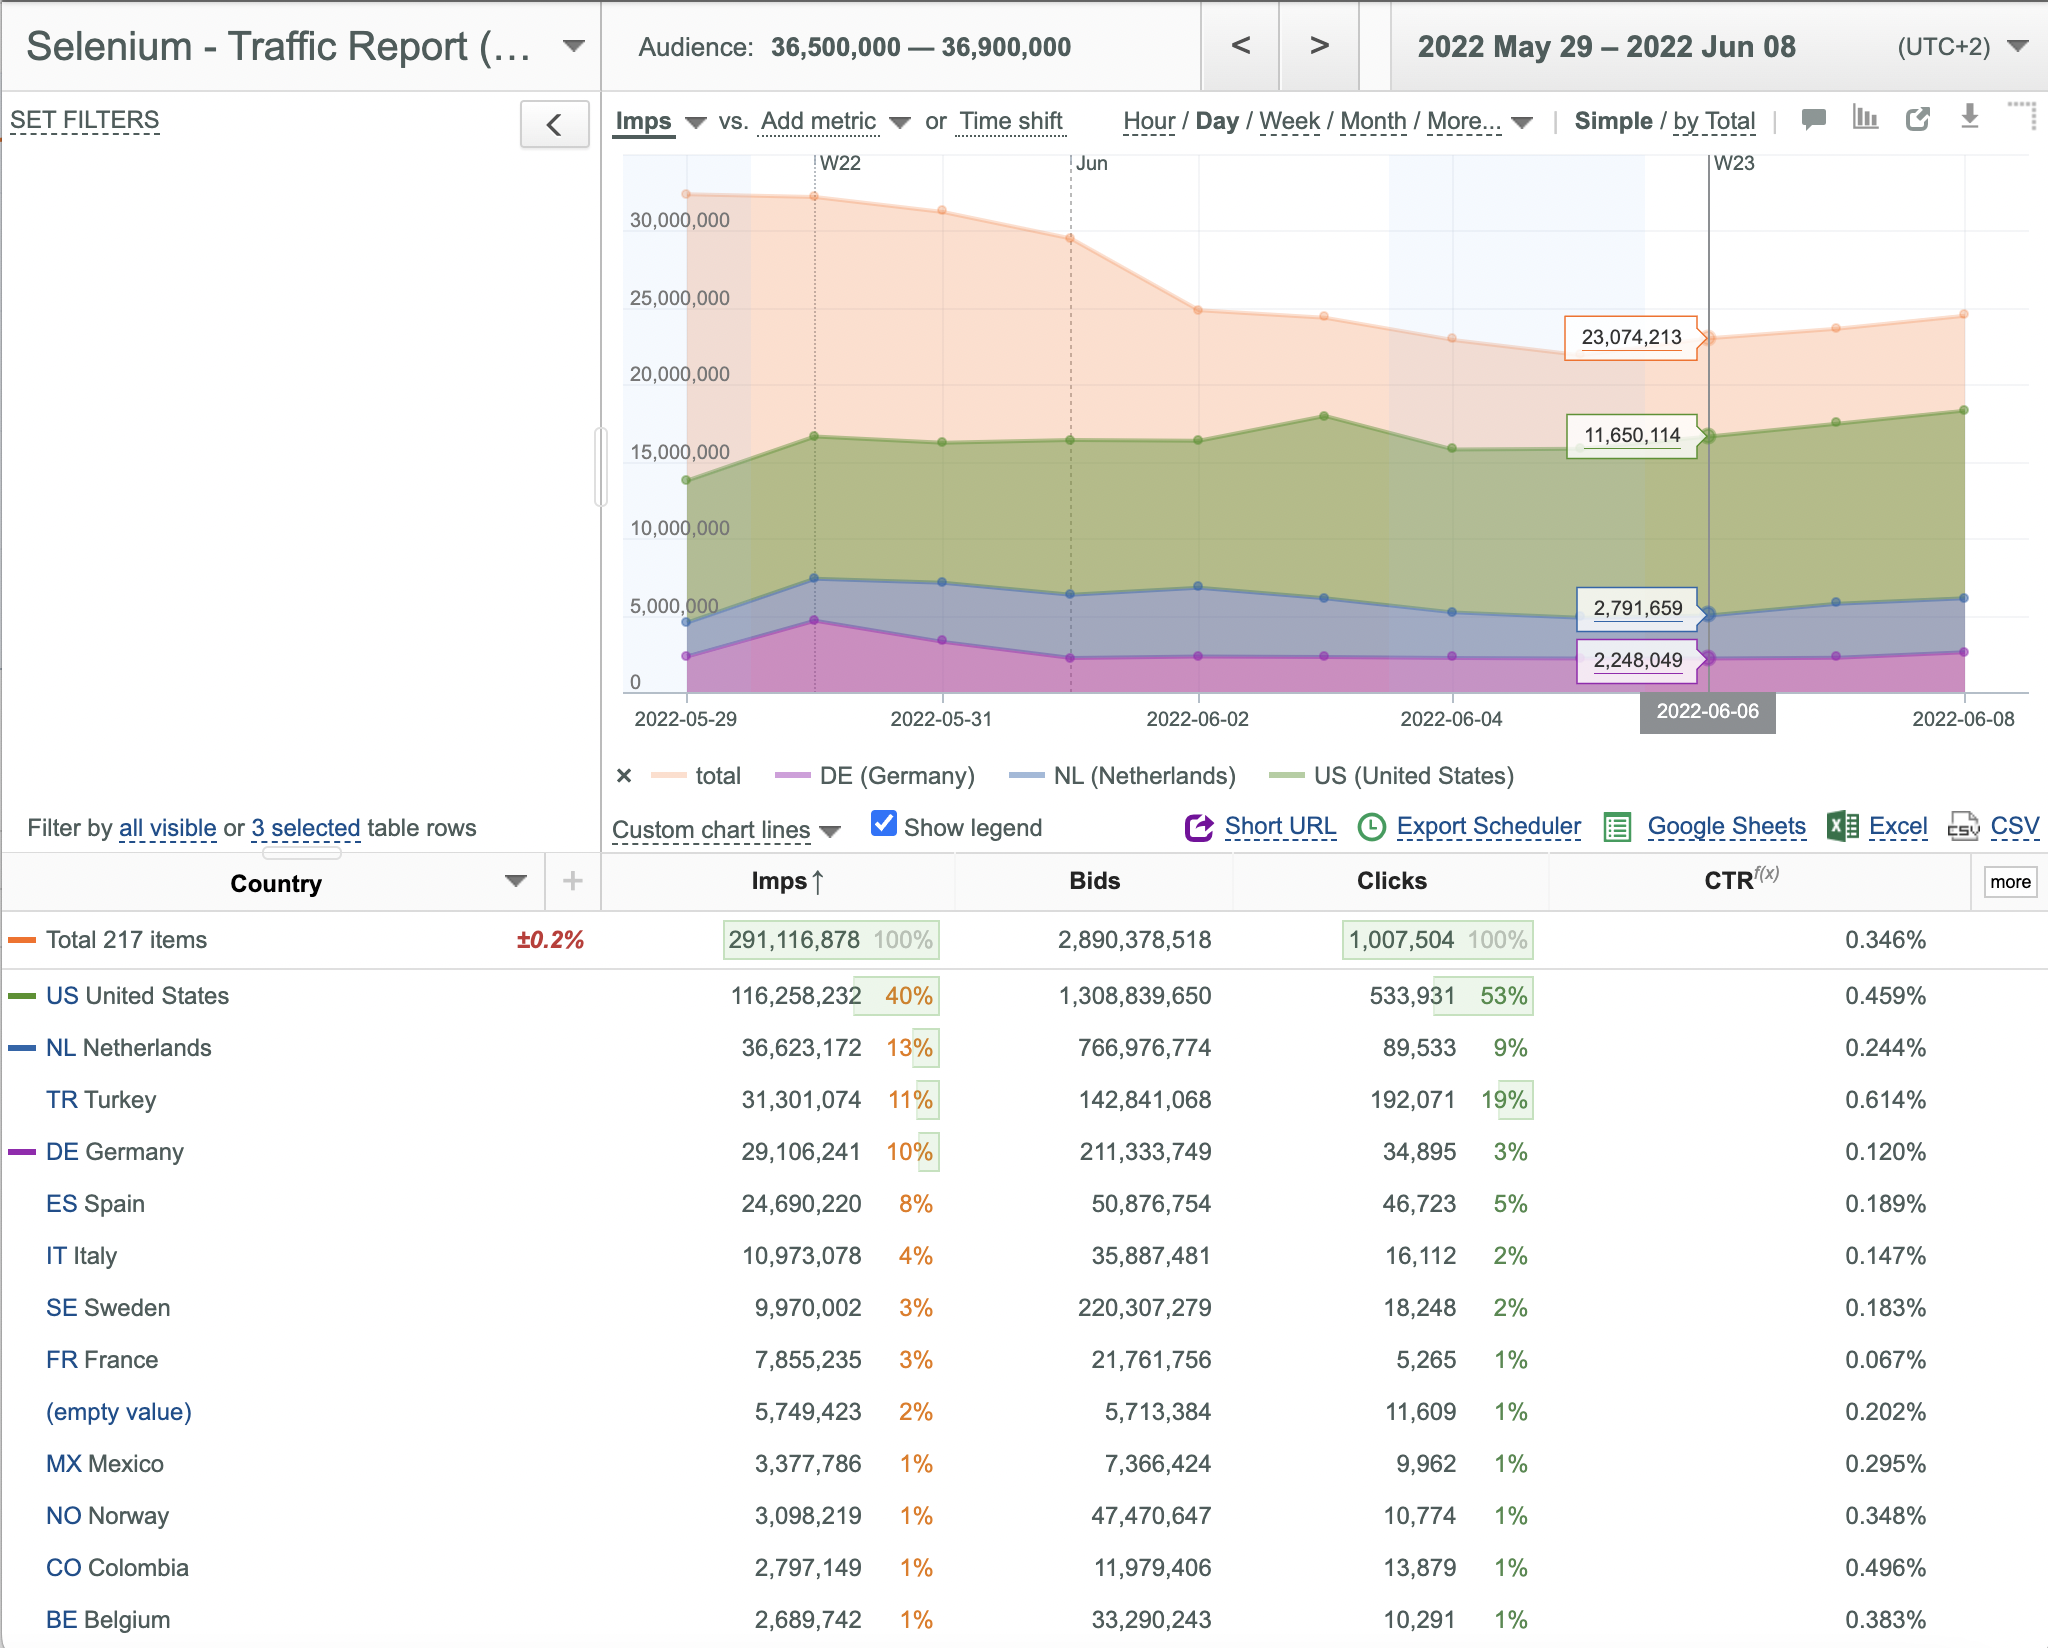
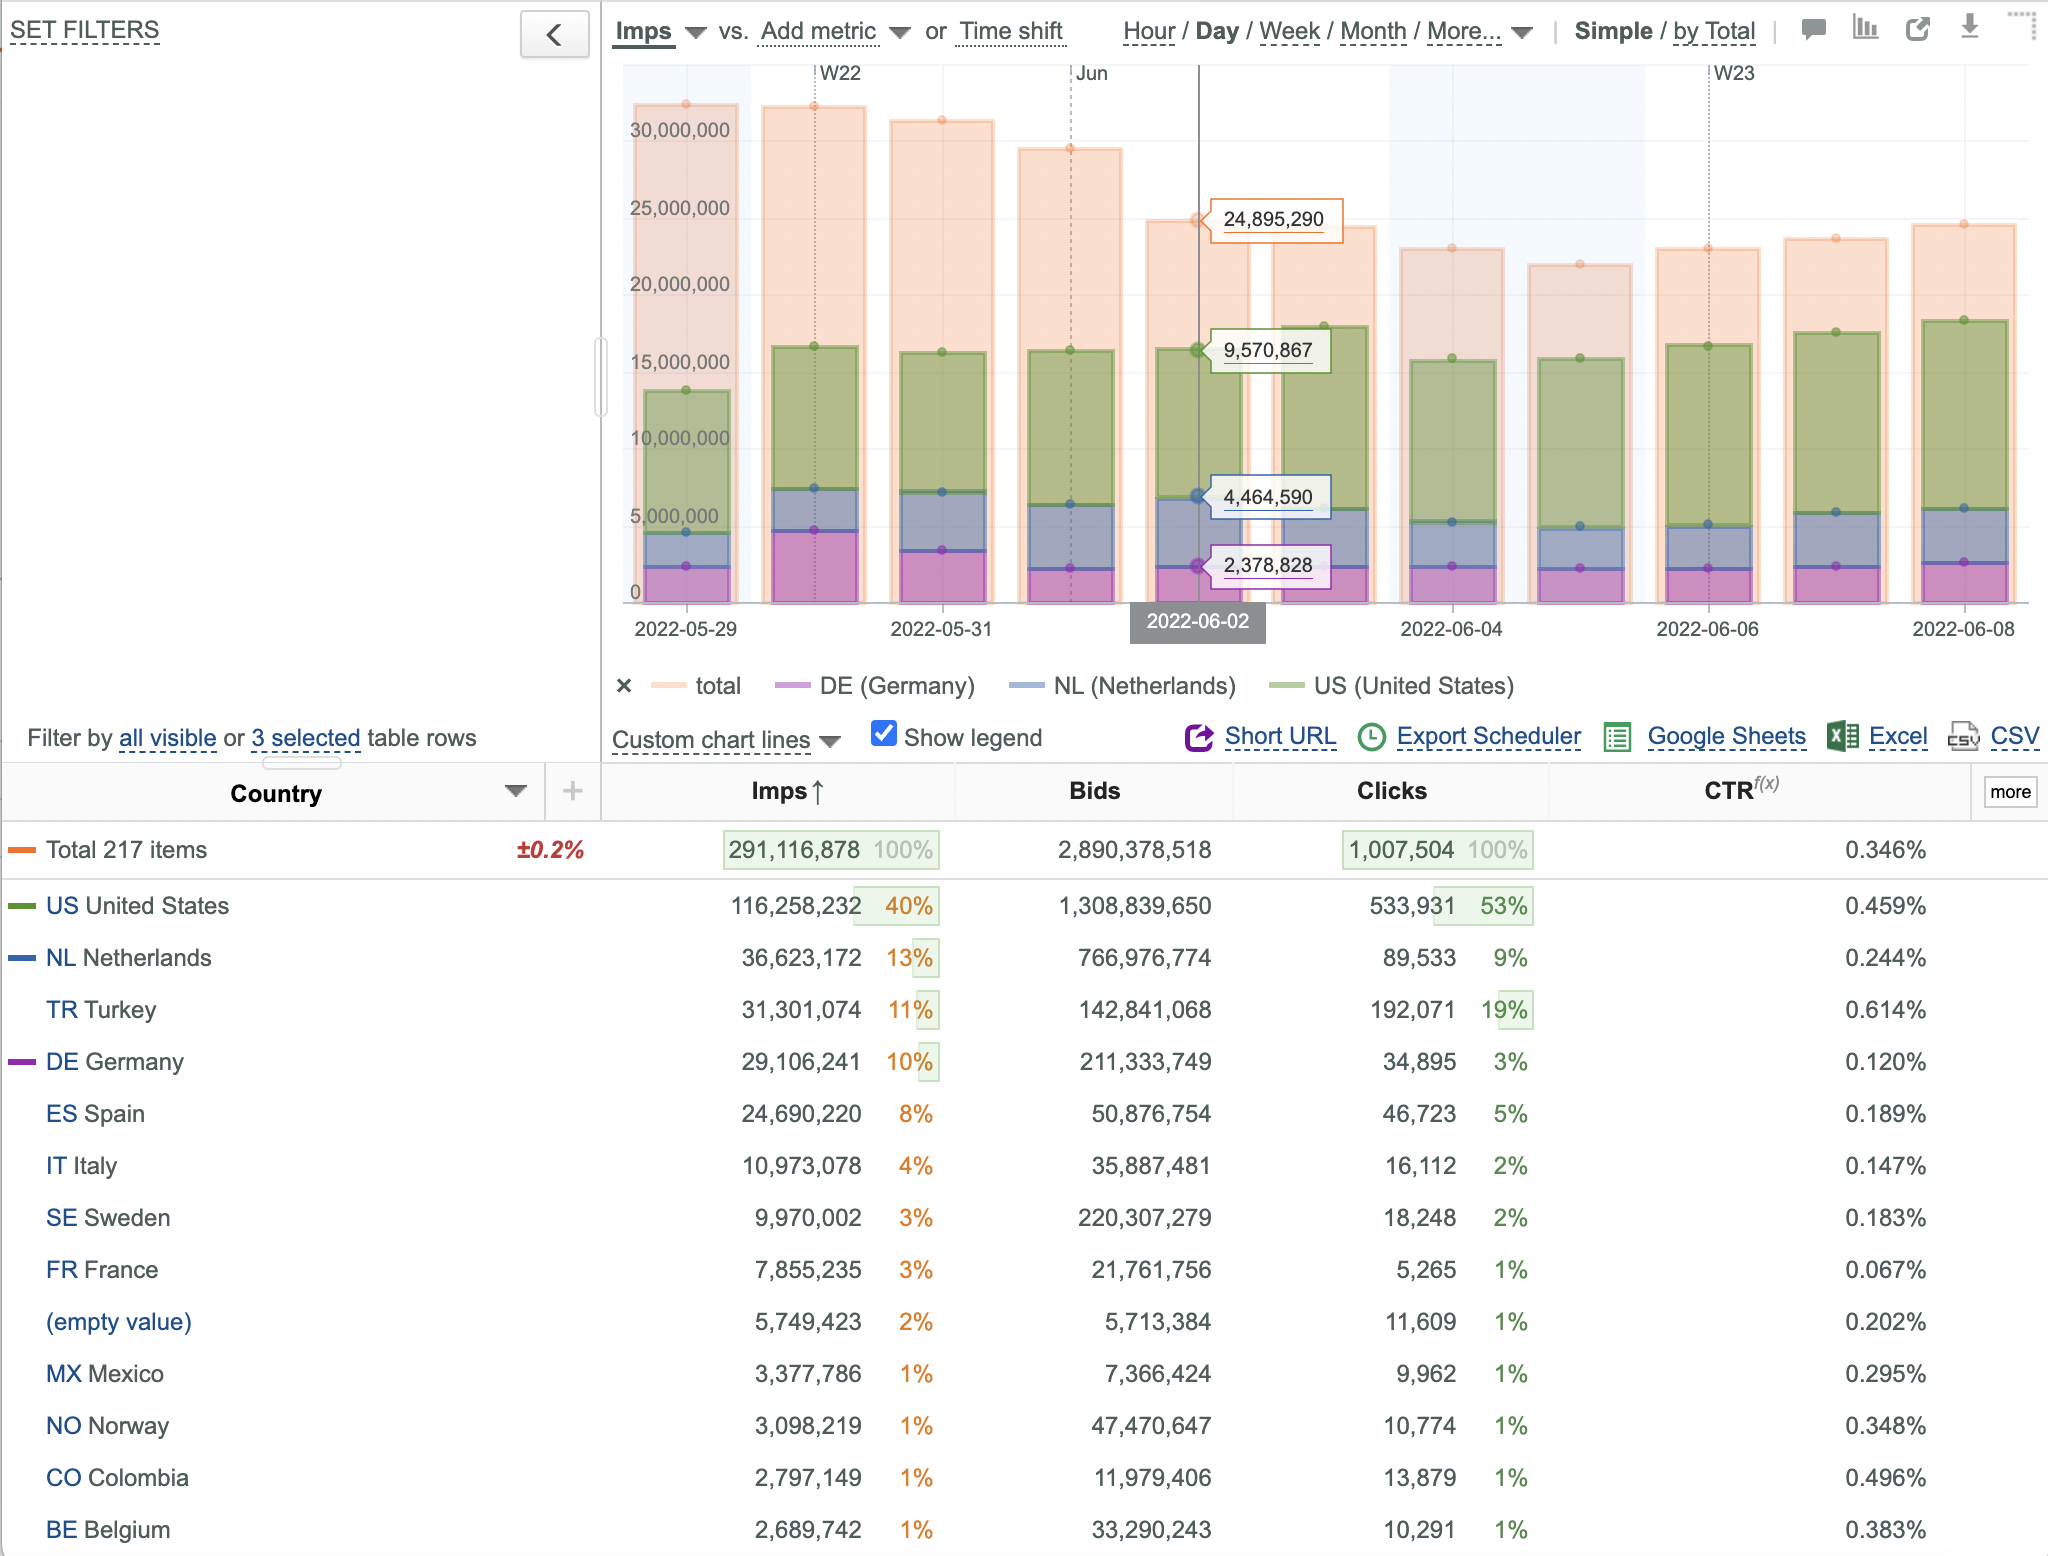
You can use plots of 3 different types: Line, Area and Column. The default type is Line.
To use a particular Plot type:
- Click the Chart settings
 button in the upper right corner.
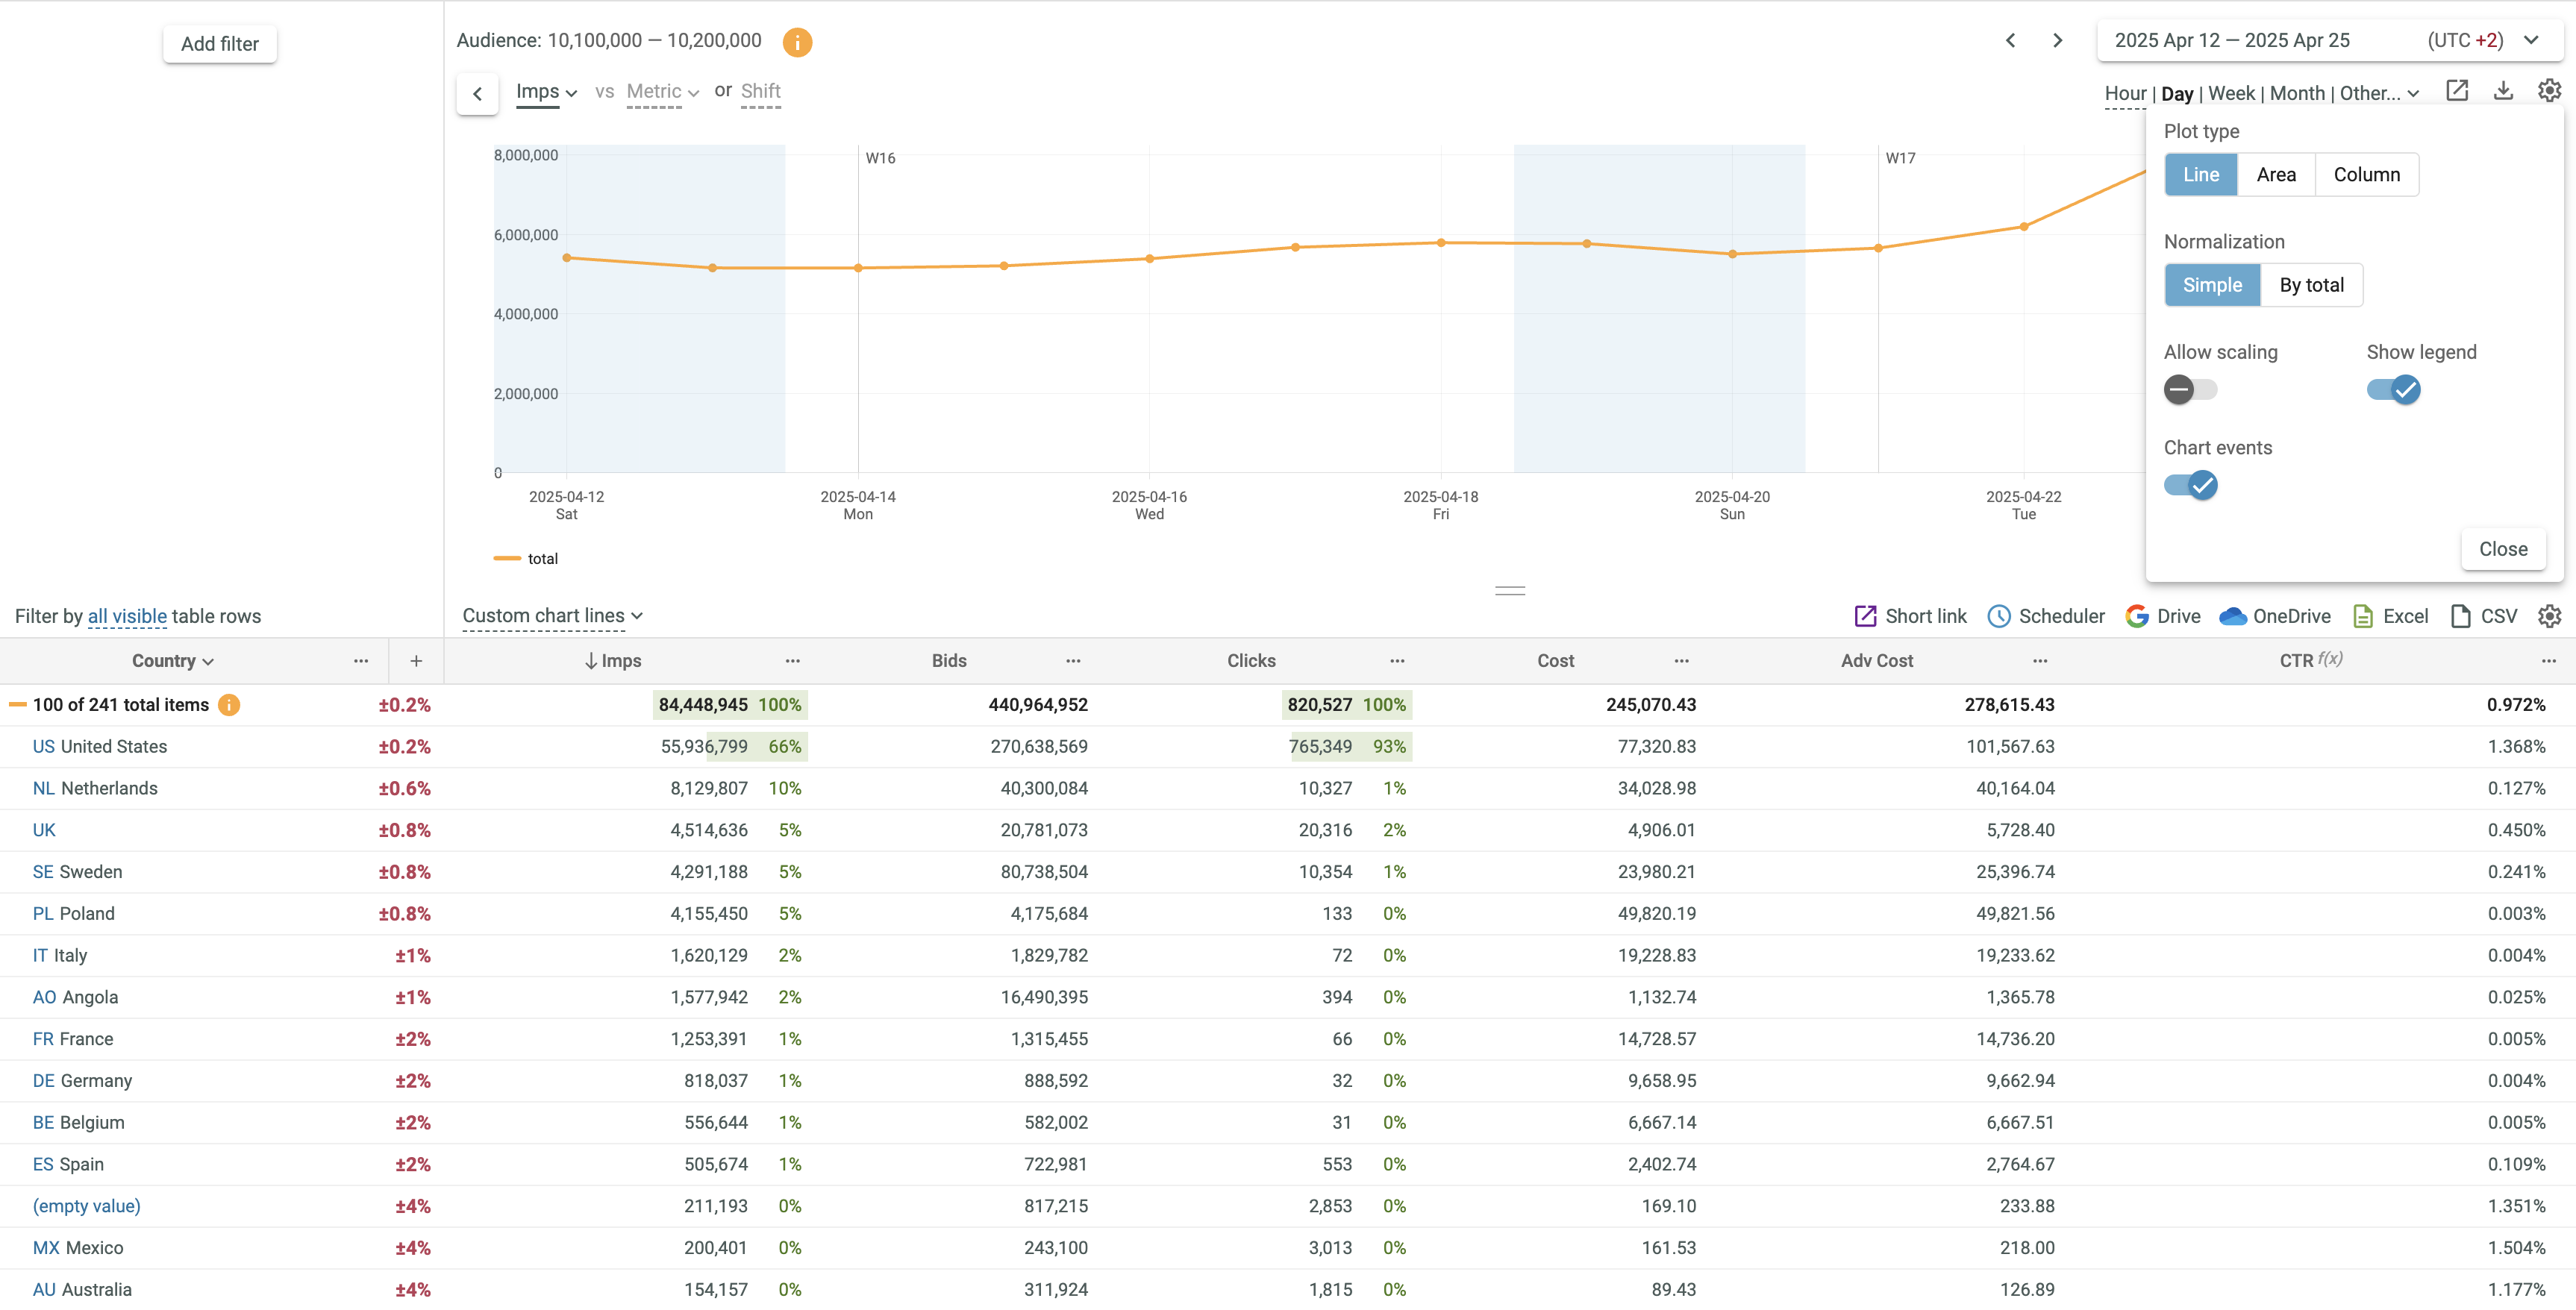
- Select the desired Plot type from the appeared dialog box.
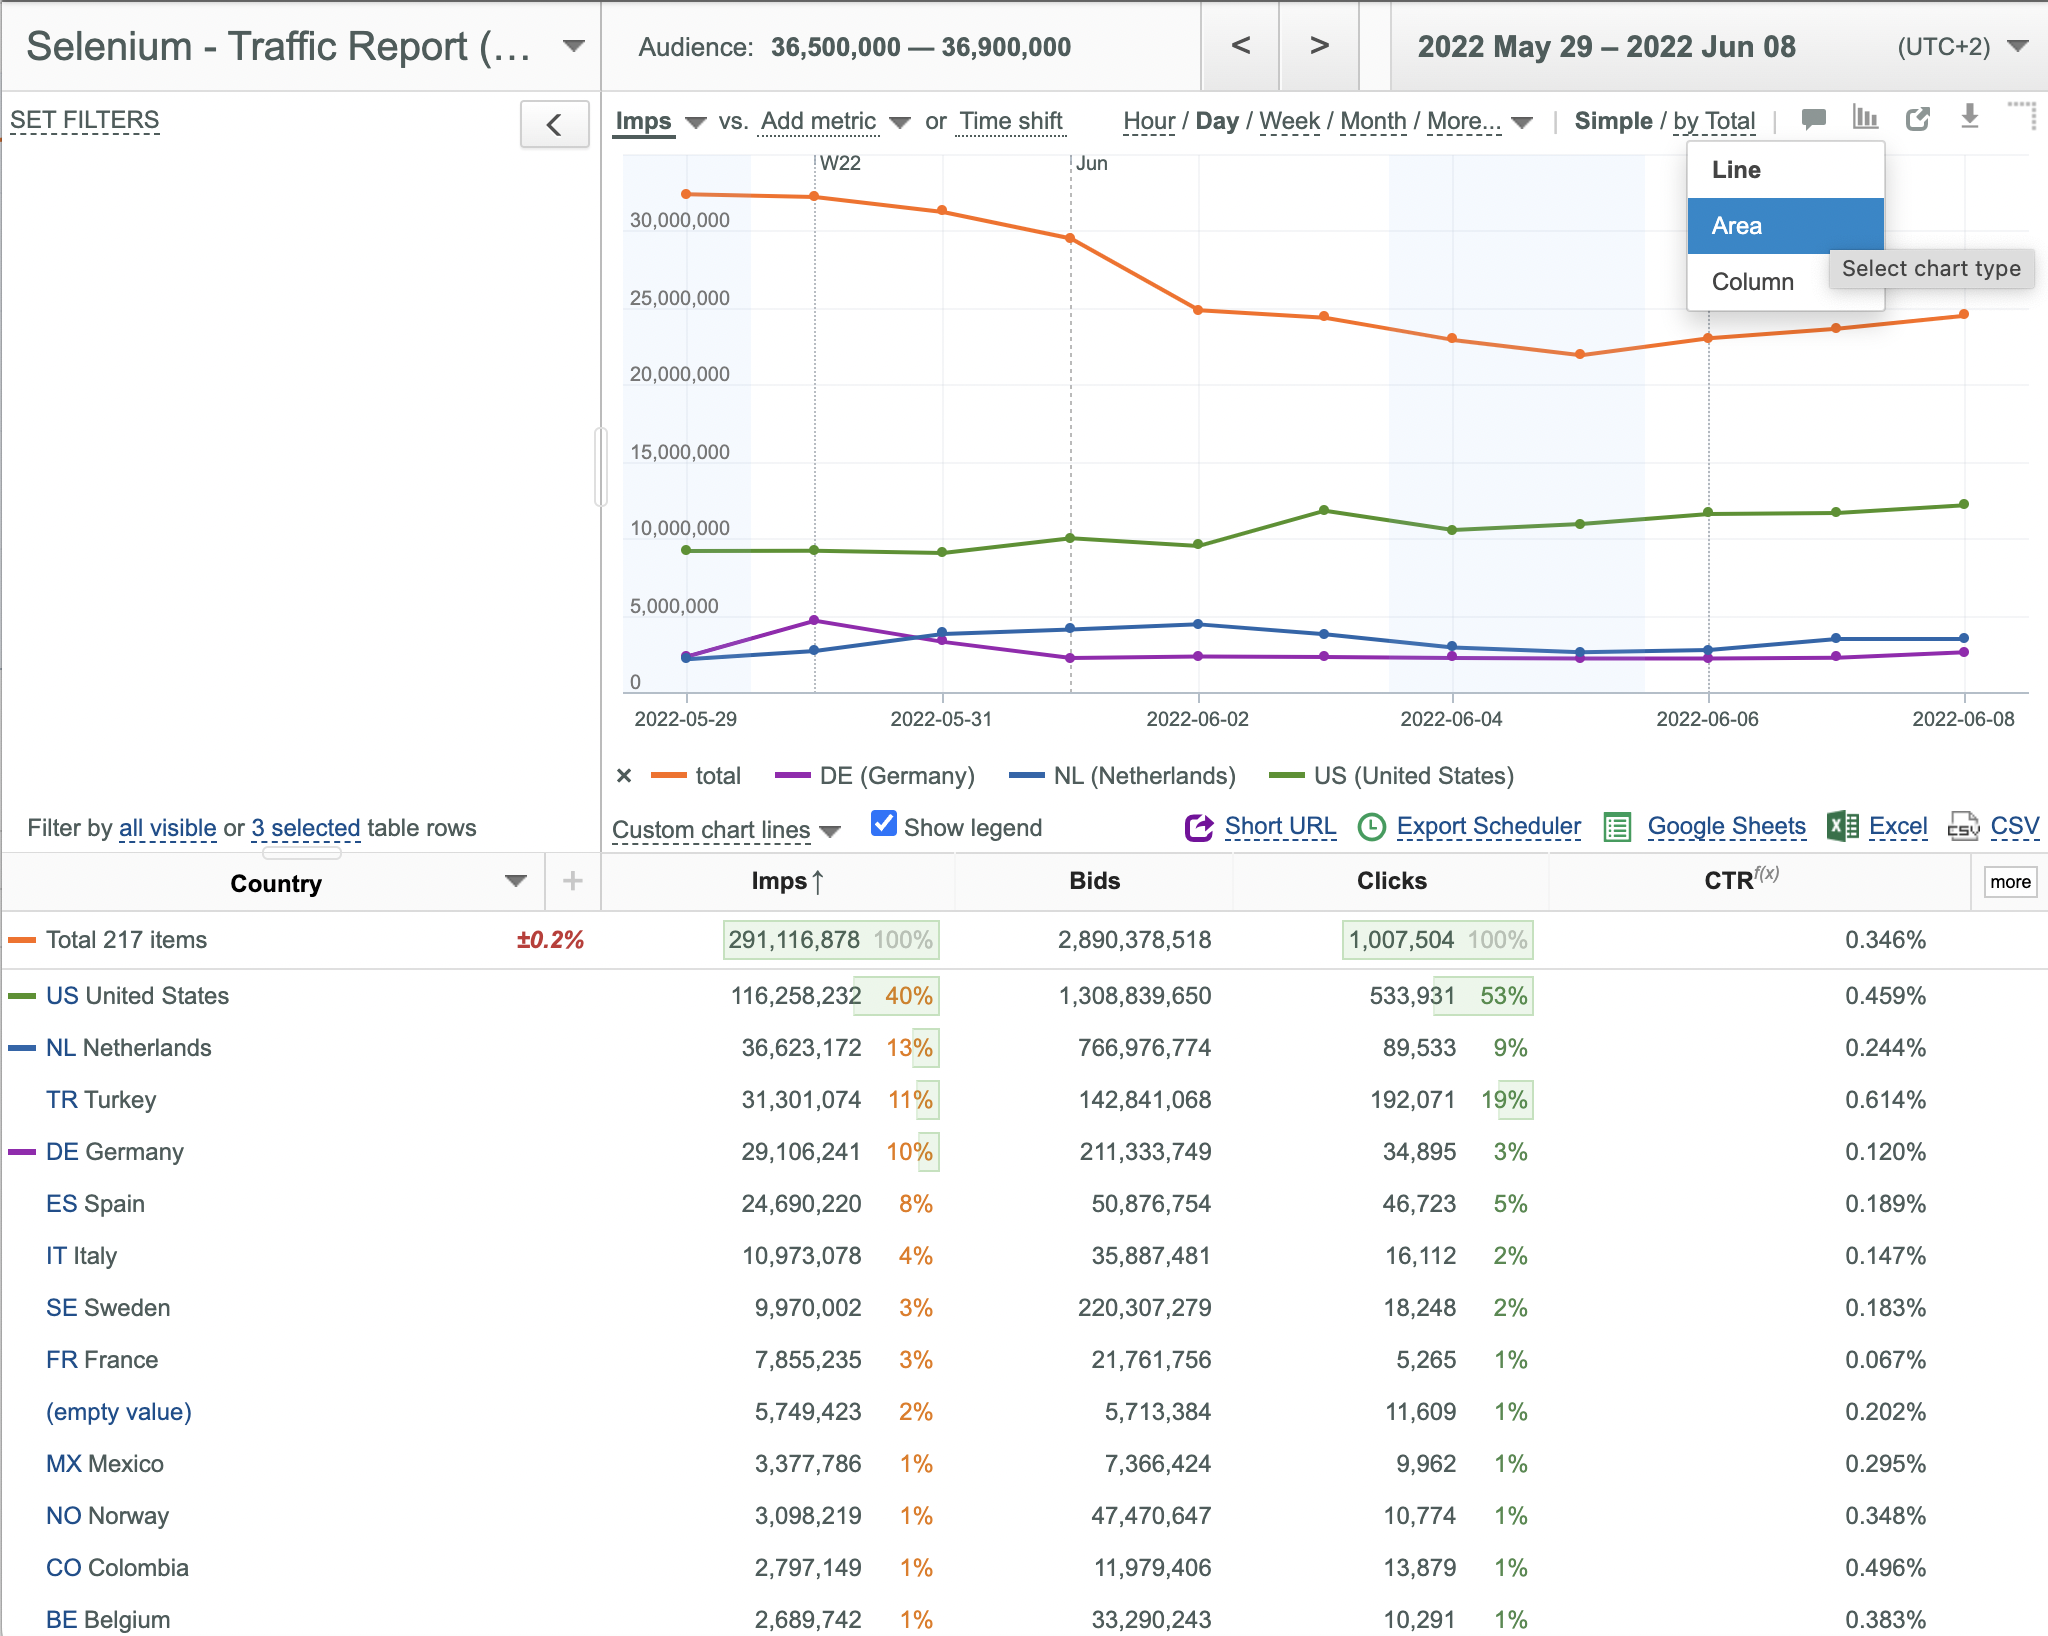
- If 1 metric is selected, all 3 plot types are supported.
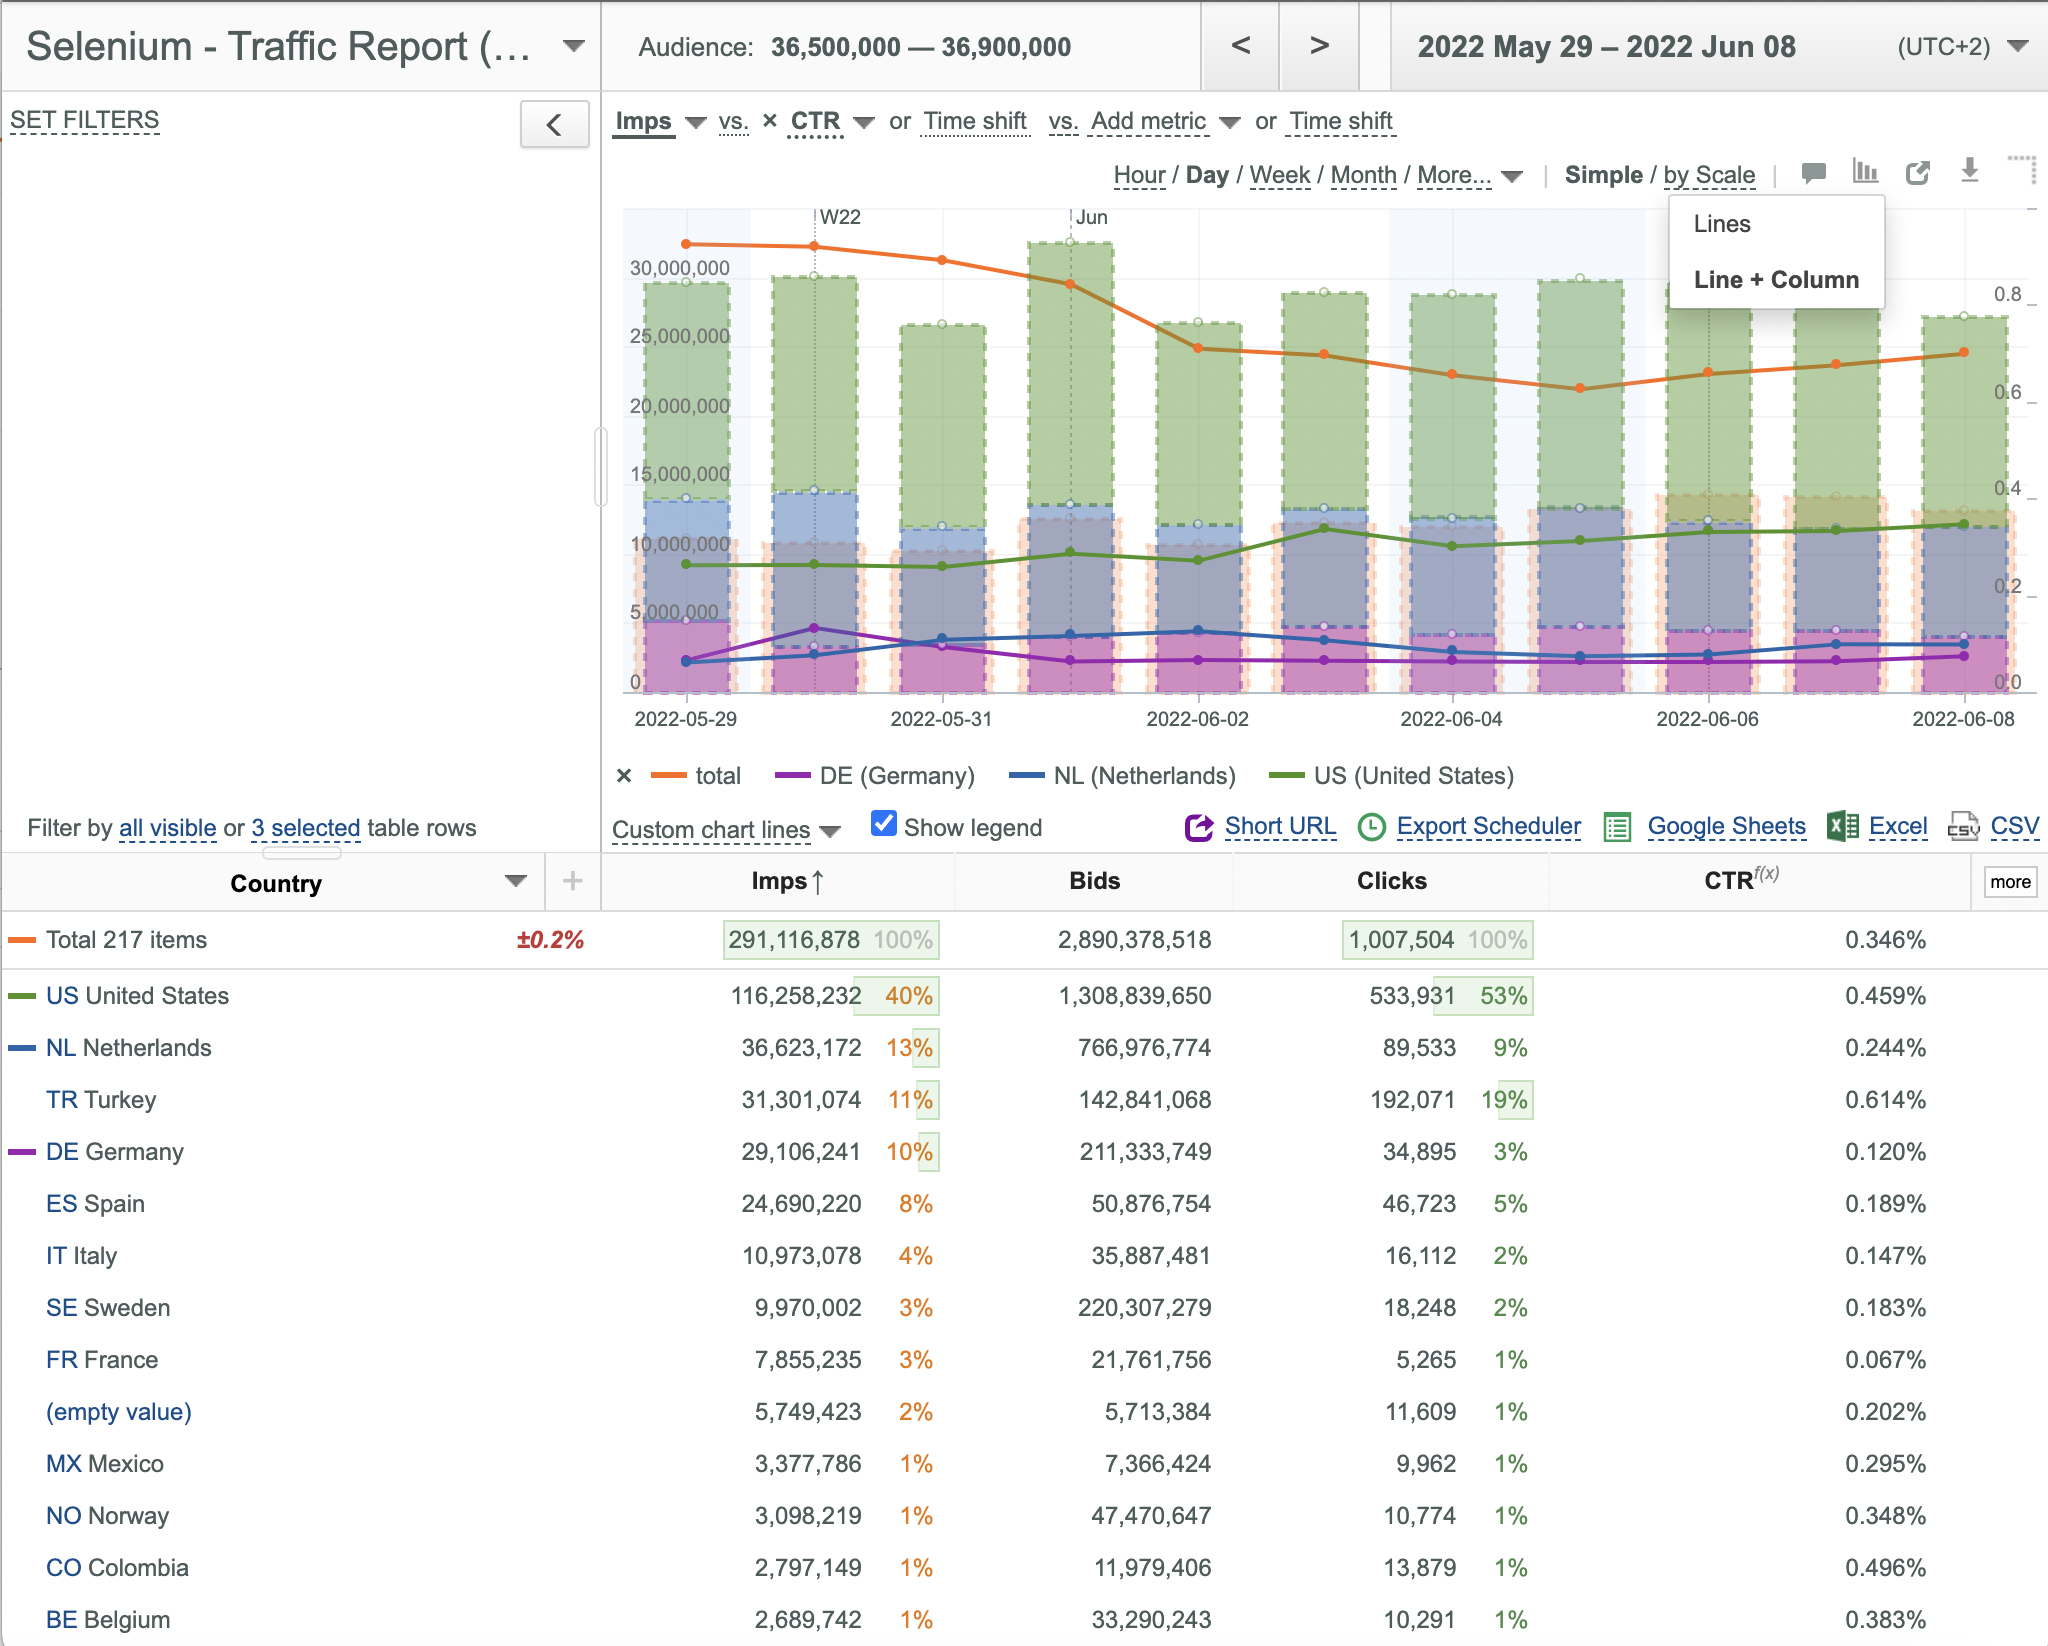
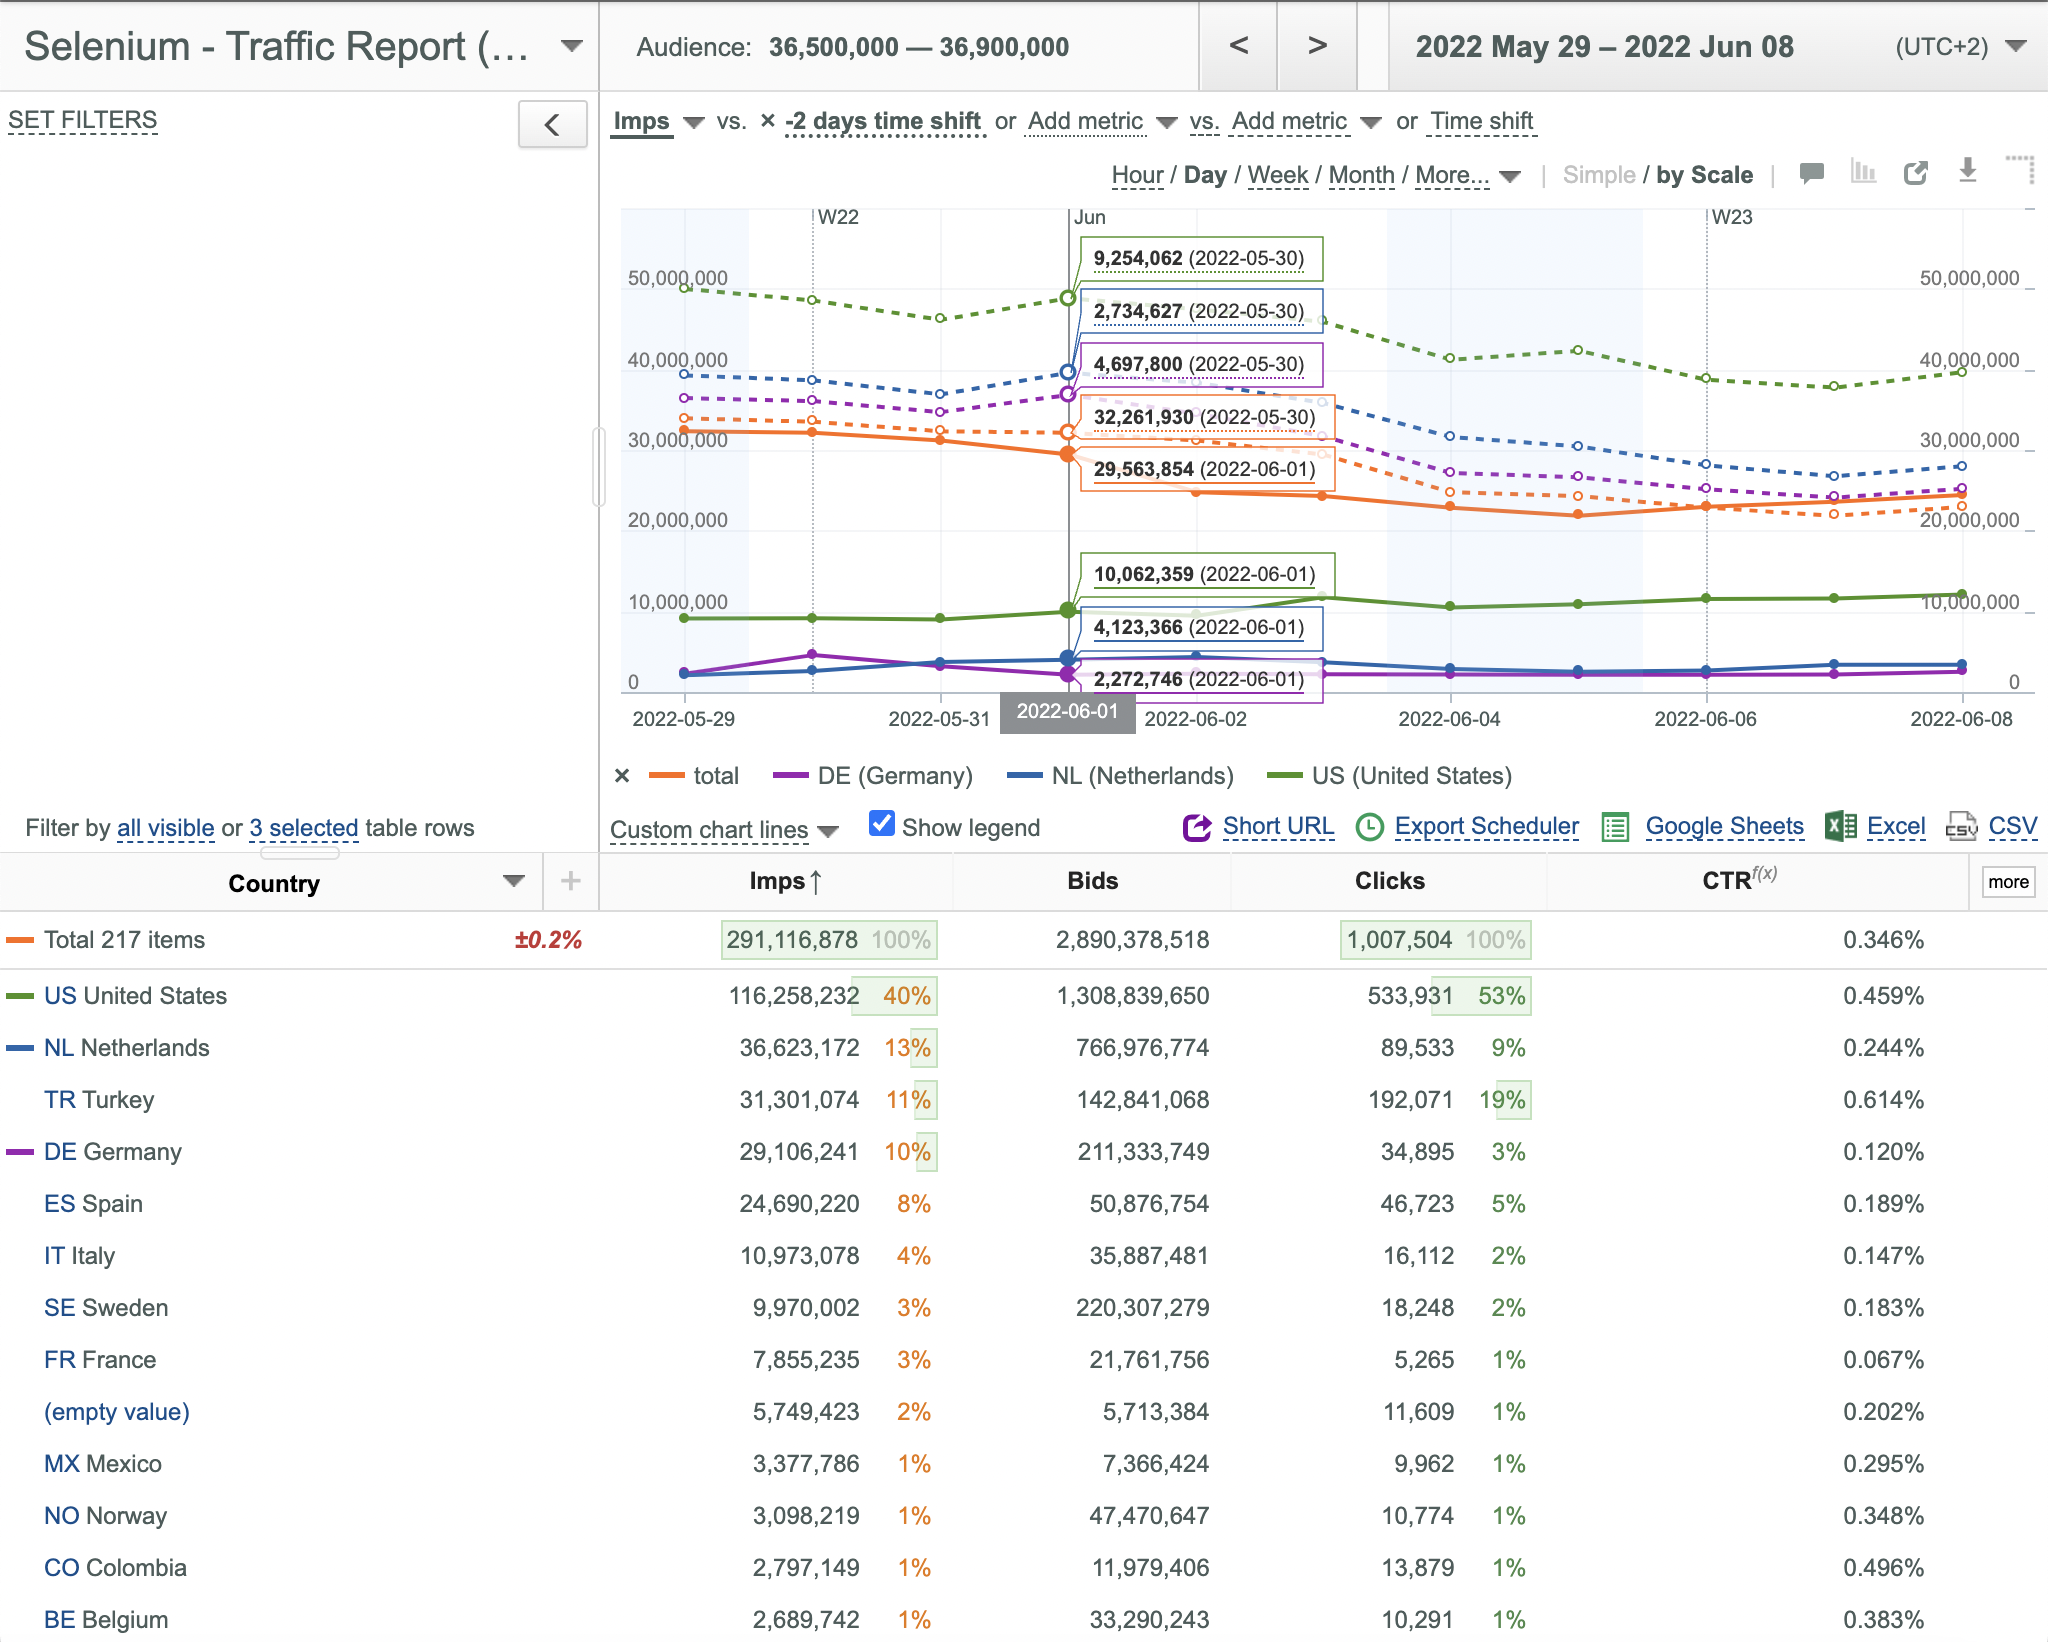
- If 2 metrics or time shift are selected, Lines and Line + Column options only are supported. The first metric is always displayed as Line. The second metric can be displayed as Line or Column. You can swap metrics by clicking the vs link.