Using chart event markers
Chart event markers are very useful for making public comments to particular date points on the chart.
Creating an Event marker
To create an event marker:
-
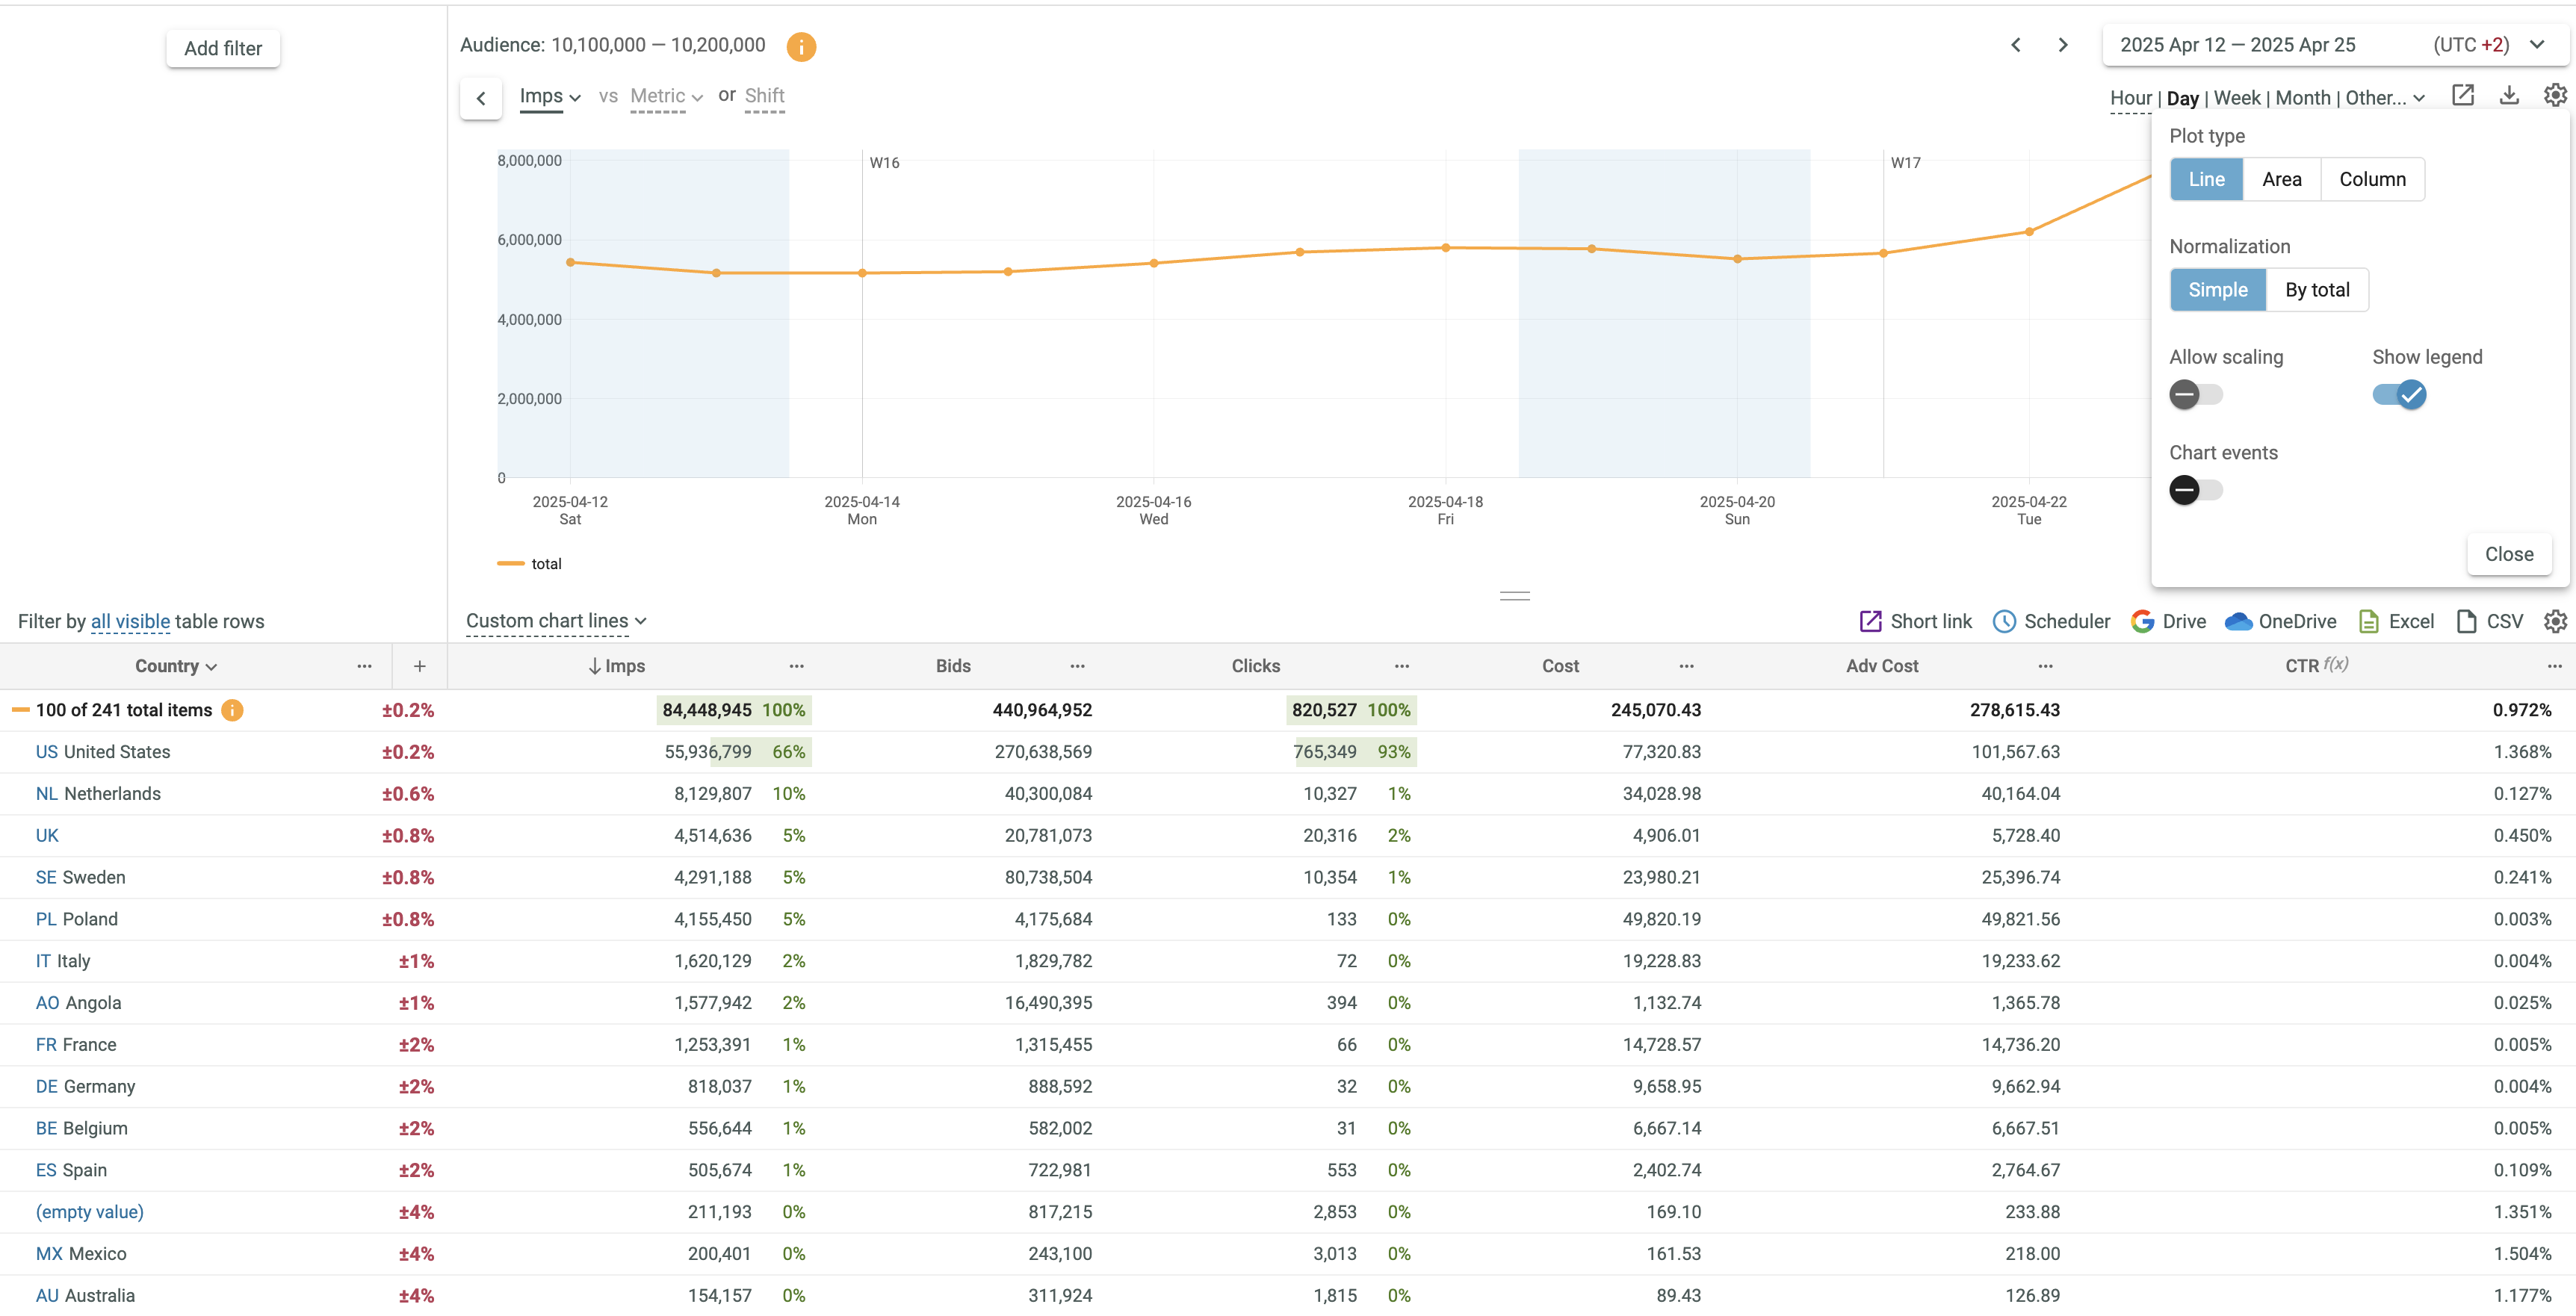
Click the Chart settings
 button.
 -
In the appeared dialog box swtch on the Chart events option.

- Select the required granularity ( Hour in this example).
- Click the required date point on the chart. The following dialog box is displayed:
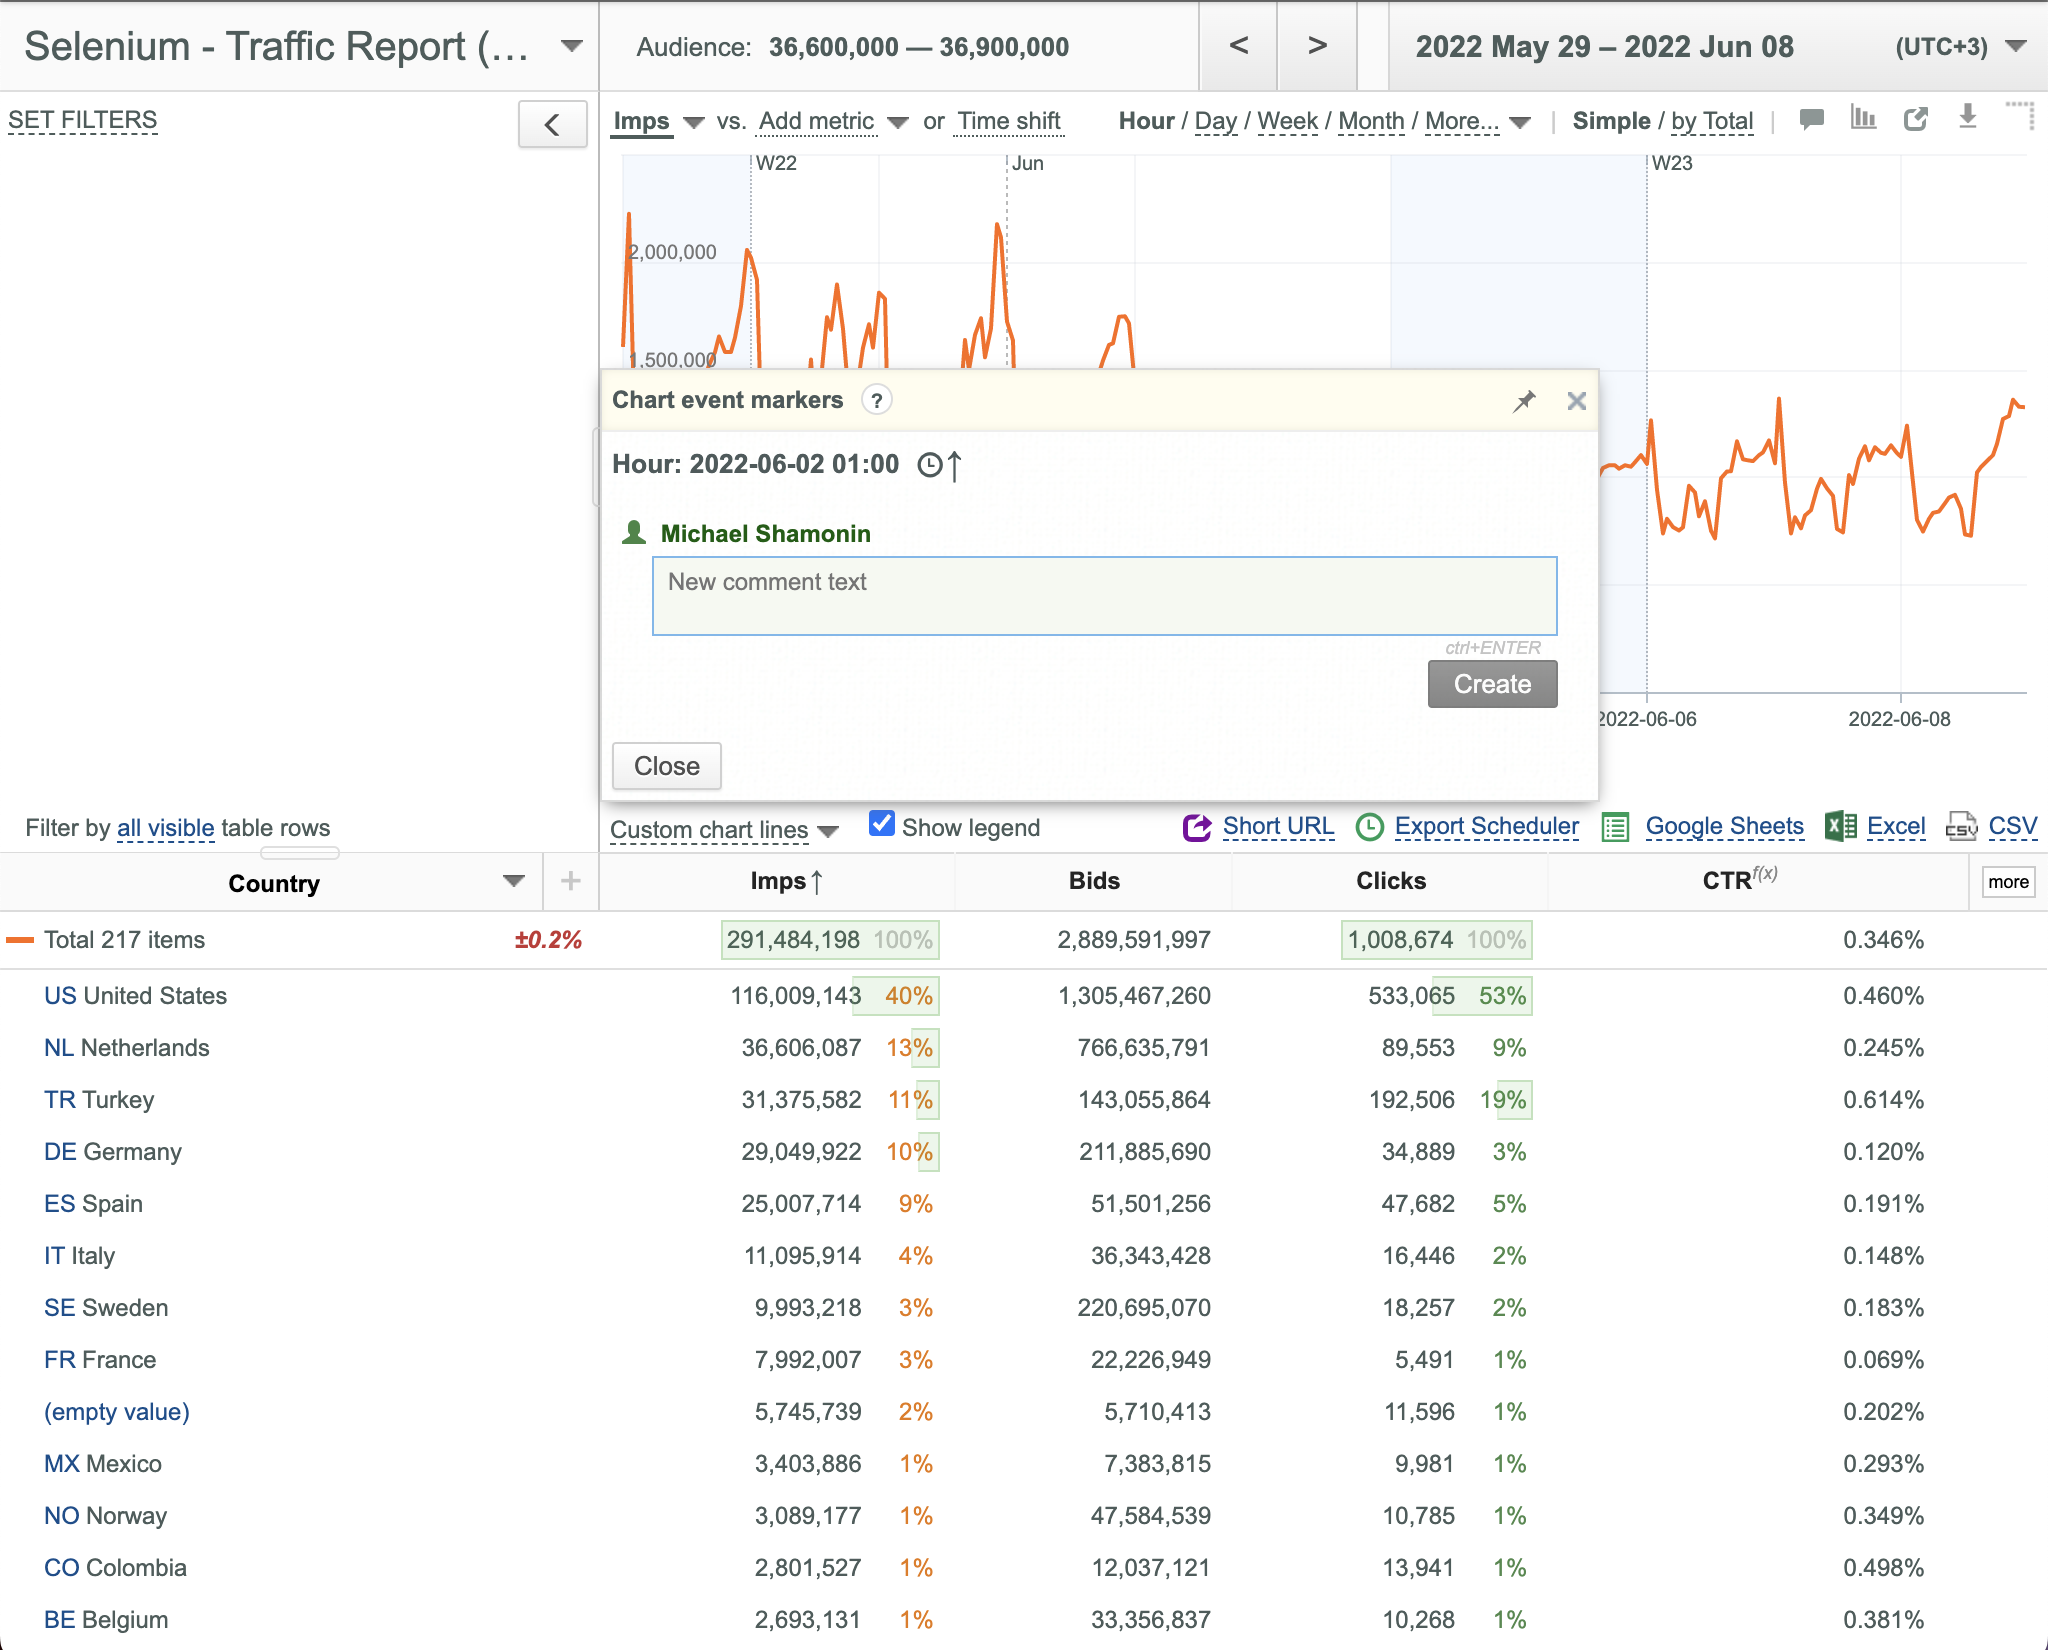
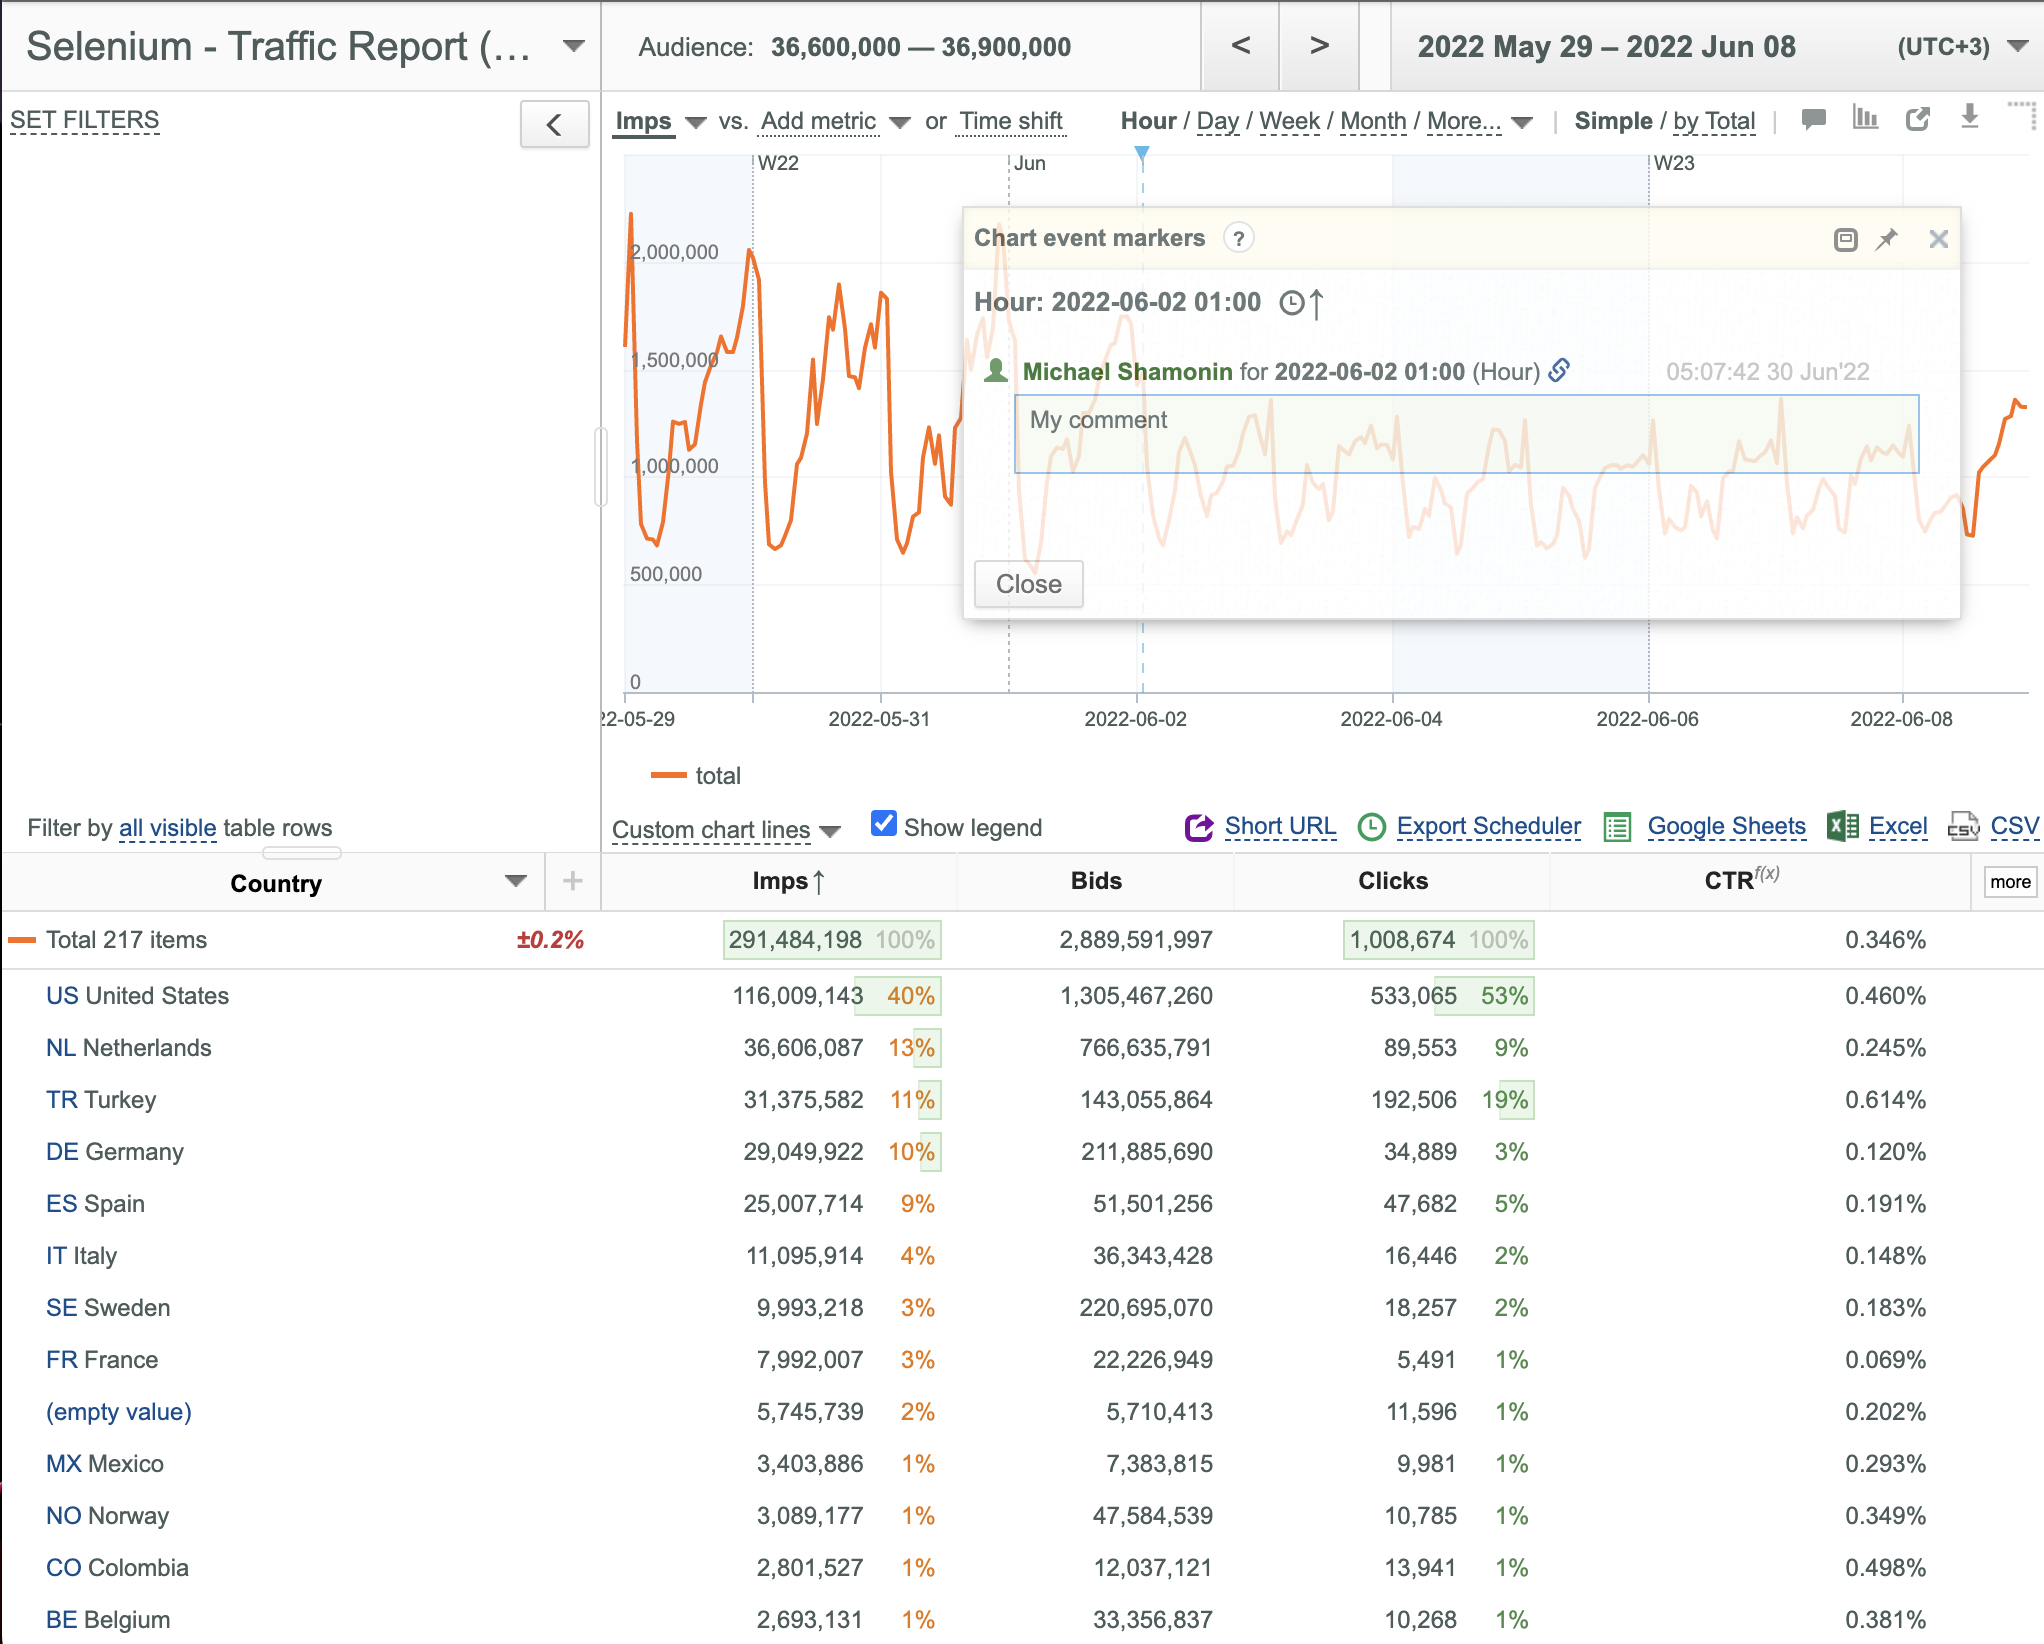
- Enter your comment and click the Save button. The newly created marker is denoted by blue triangle and vertical dash line on the chart.
Positioning the Chart Event Markers Dialog Box
To move the Chart Event Markers dialog box to the desired place on your u-Slicer UI page:
- Drag the dialog box by its header.
- Drop the dialog box at the desired position.
Sorting Chart Event Markers
To sort Chart event markers:
- Click the blue triangle matching the date point for which sorting is required.
- Click the
 button in the appeared Event markers dialog box.
Editing Chart Event Markers
To edit an existing Chart event marker:
- Click the blue triangle matching the marker to be edited (one blue triangle can match one or more markers).
- Edit the desired comment in the appeared Event markers dialog box.
- Click the Save button.
Removing an Existing Chart Event Marker
To remove an existing Chart event marker:
- Click the blue triangle matching the marker to be removed.
- Click the corresponding
 button in the appeared Event markers dialog box.
 - Click Yes in the appeared confirmation dialog box to confirm the operation.
Enabling/Disabling Chart Event Markers
To enable Chart event markers:
-
Click the Chart settings
button. -
In the appeared dialog box swtch on the Chart events option.
To disable Chart event markers:
-
Click the Chart settings
button. -
In the appeared dialog box swtch off the Chart events option.