Normalizing chart by total
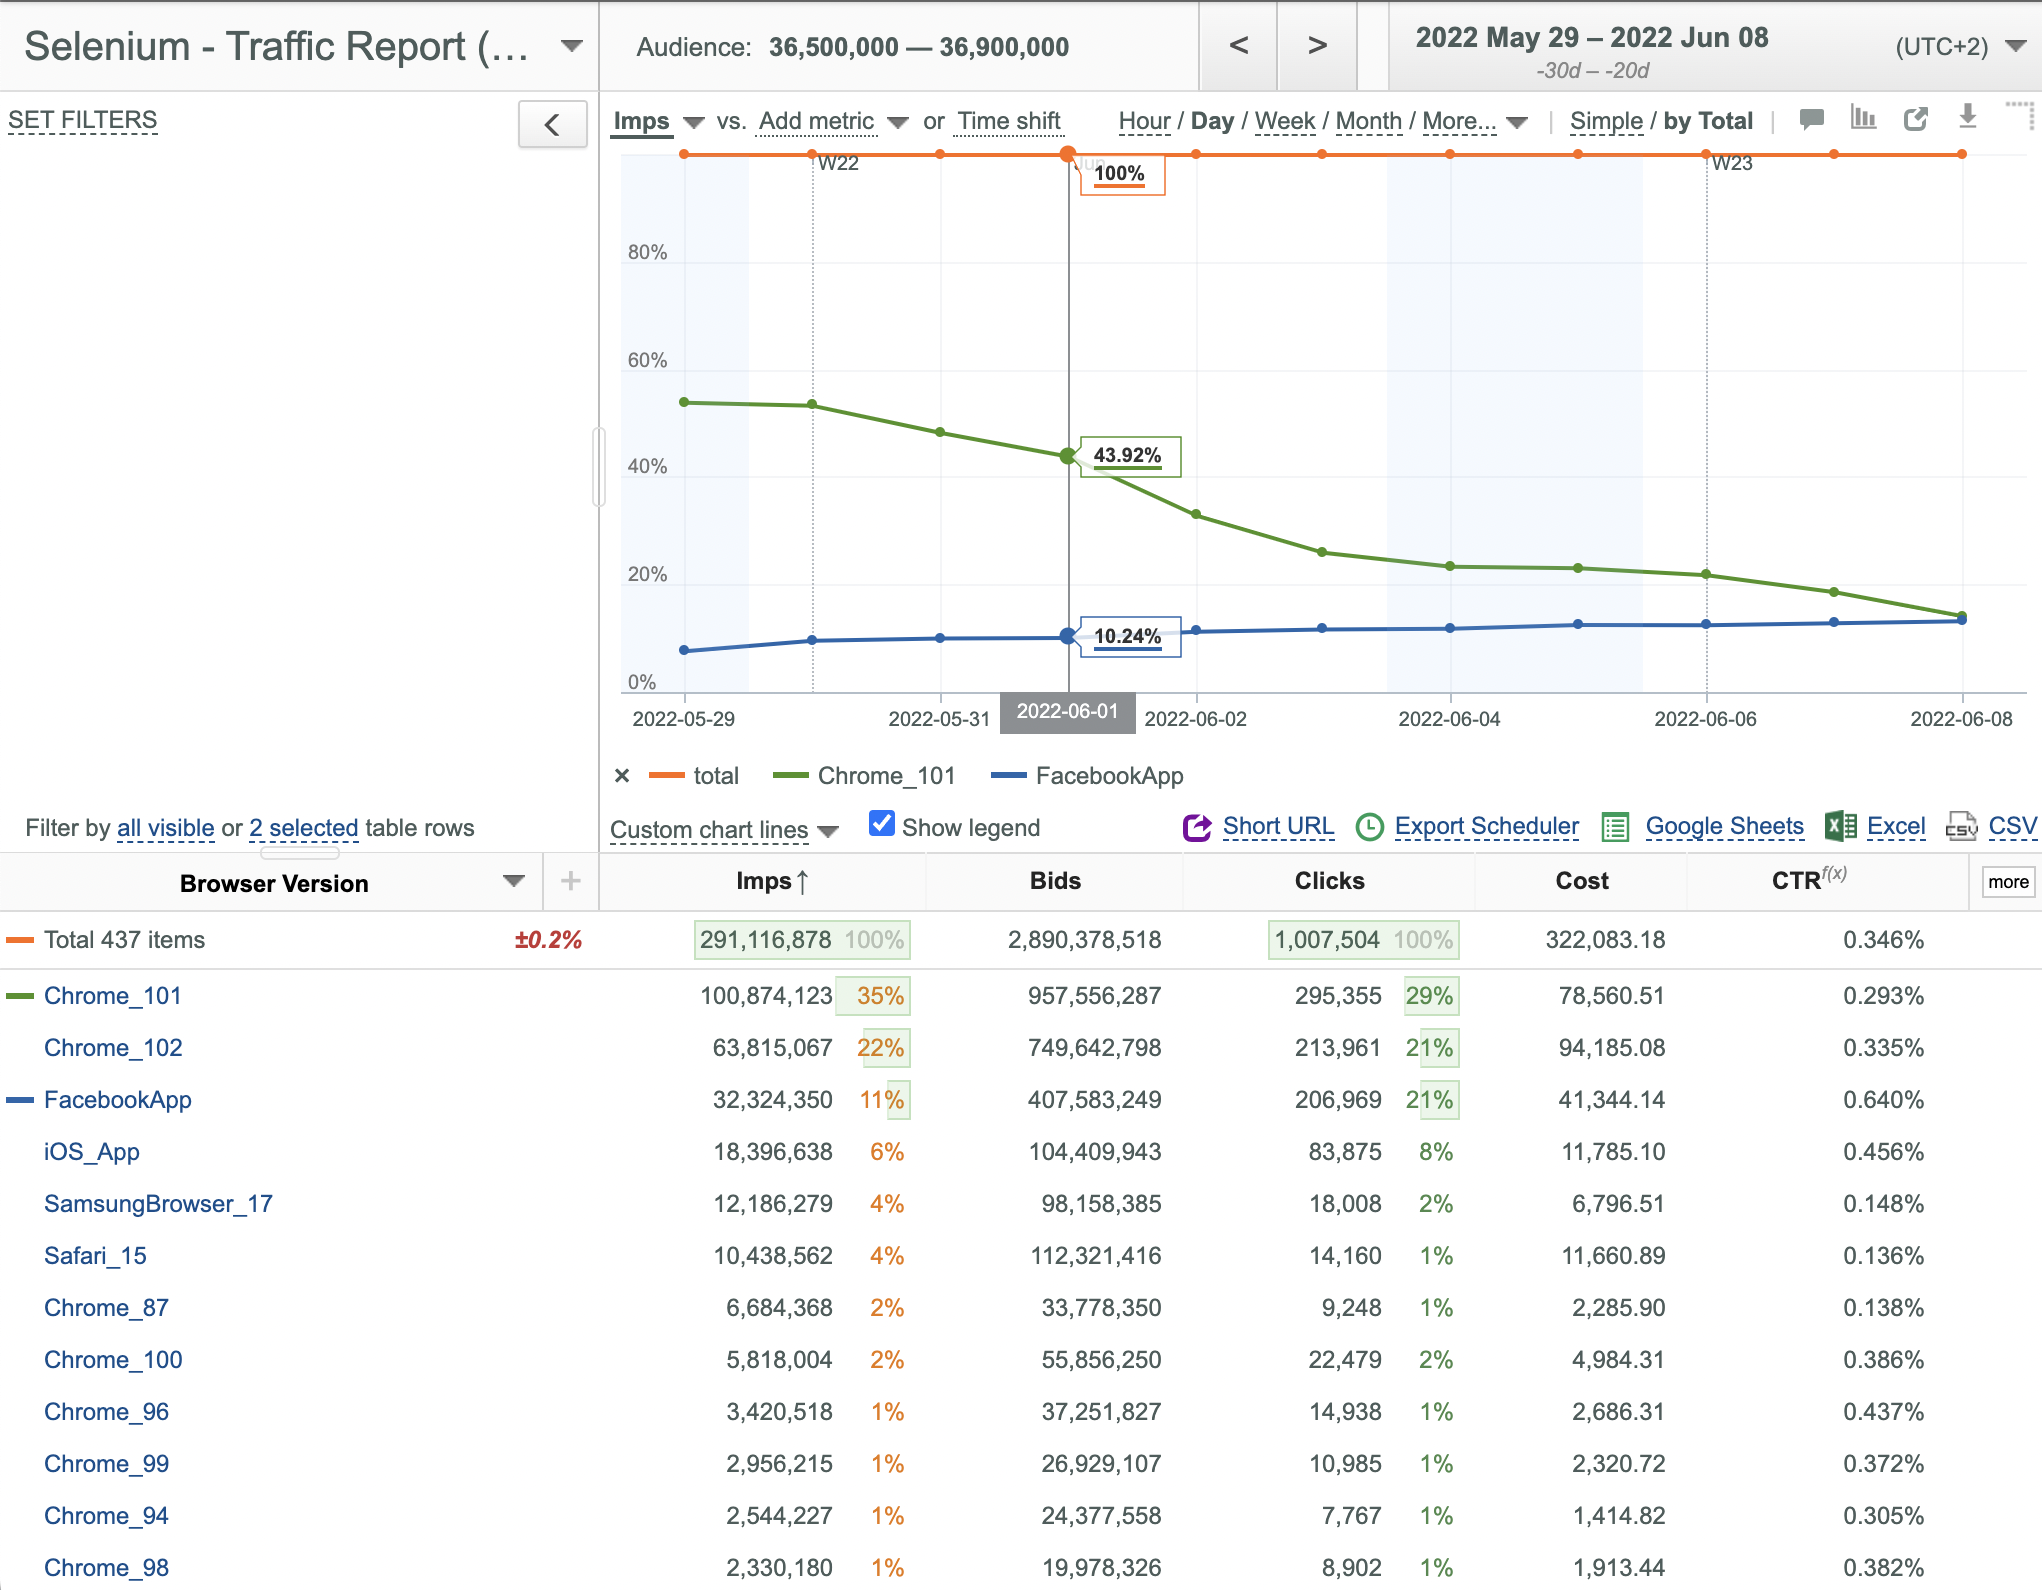
Normalization by Total is very useful, if you want to see % of each selected Plot relative to Total.
To Normalize Chart by Total:
- Select the desired data rows for plotting (at least 1 data row should be selected, and Total should be present on the Chart).
-
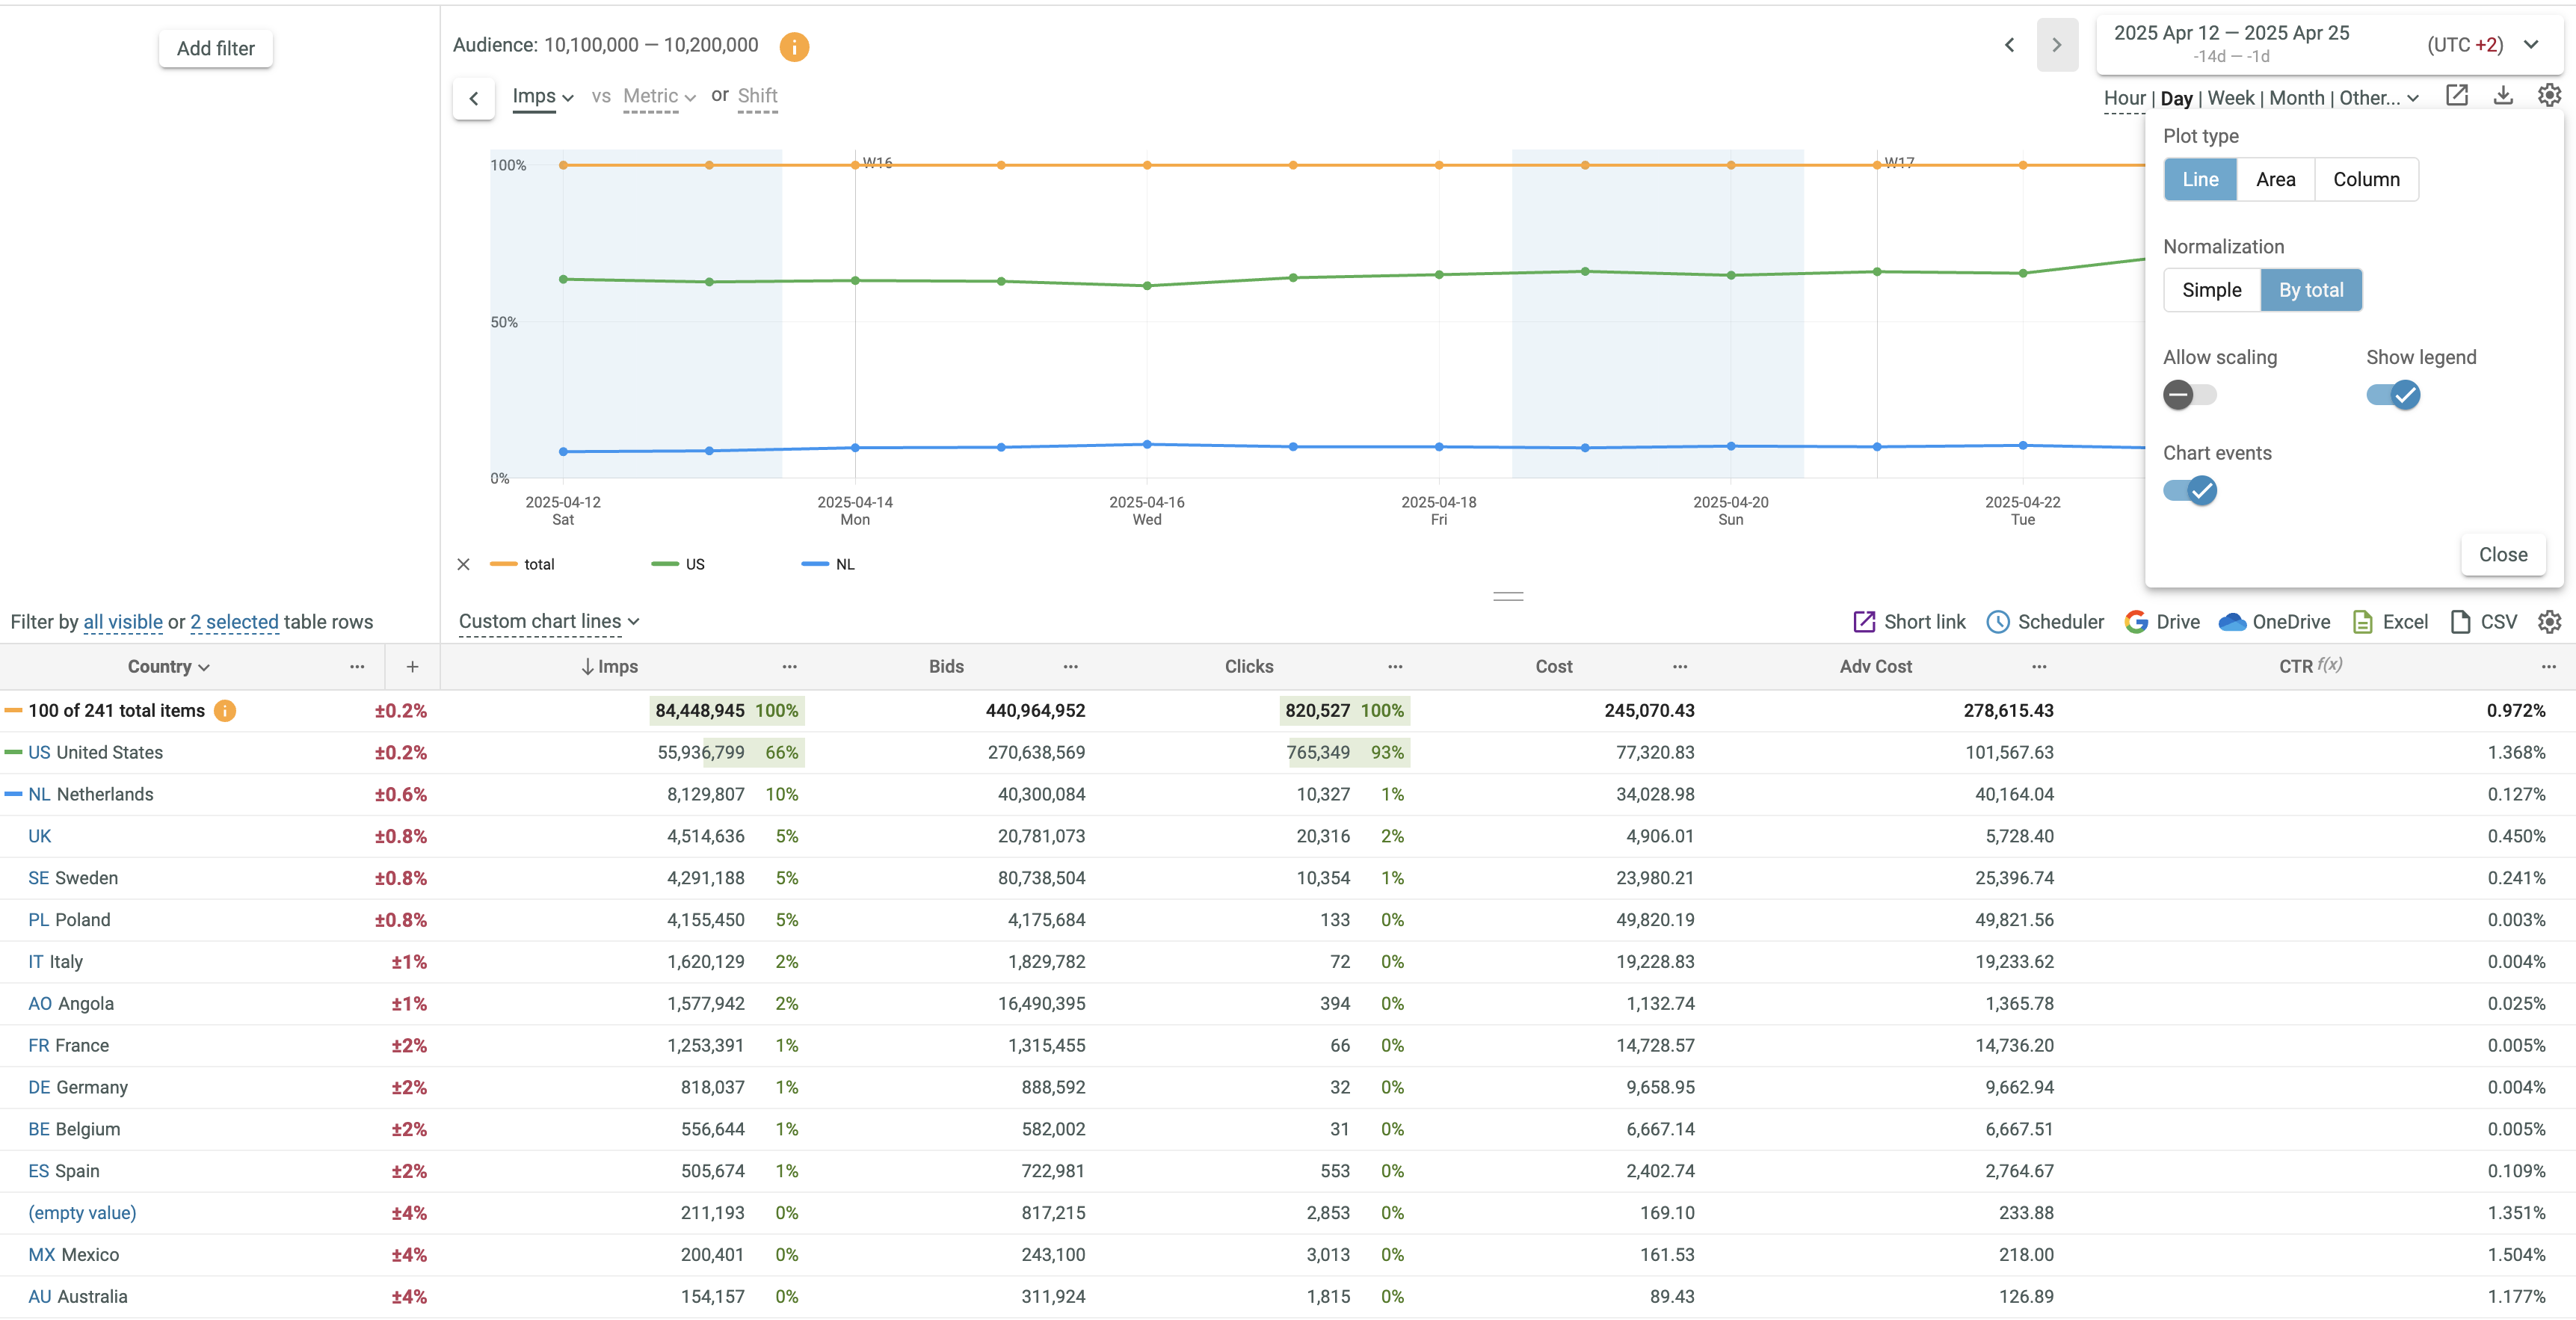
Click the Chart settings
 button.
 -
In the appeared dialog box set Normalization to By total.
- Click the
 button.